HOME
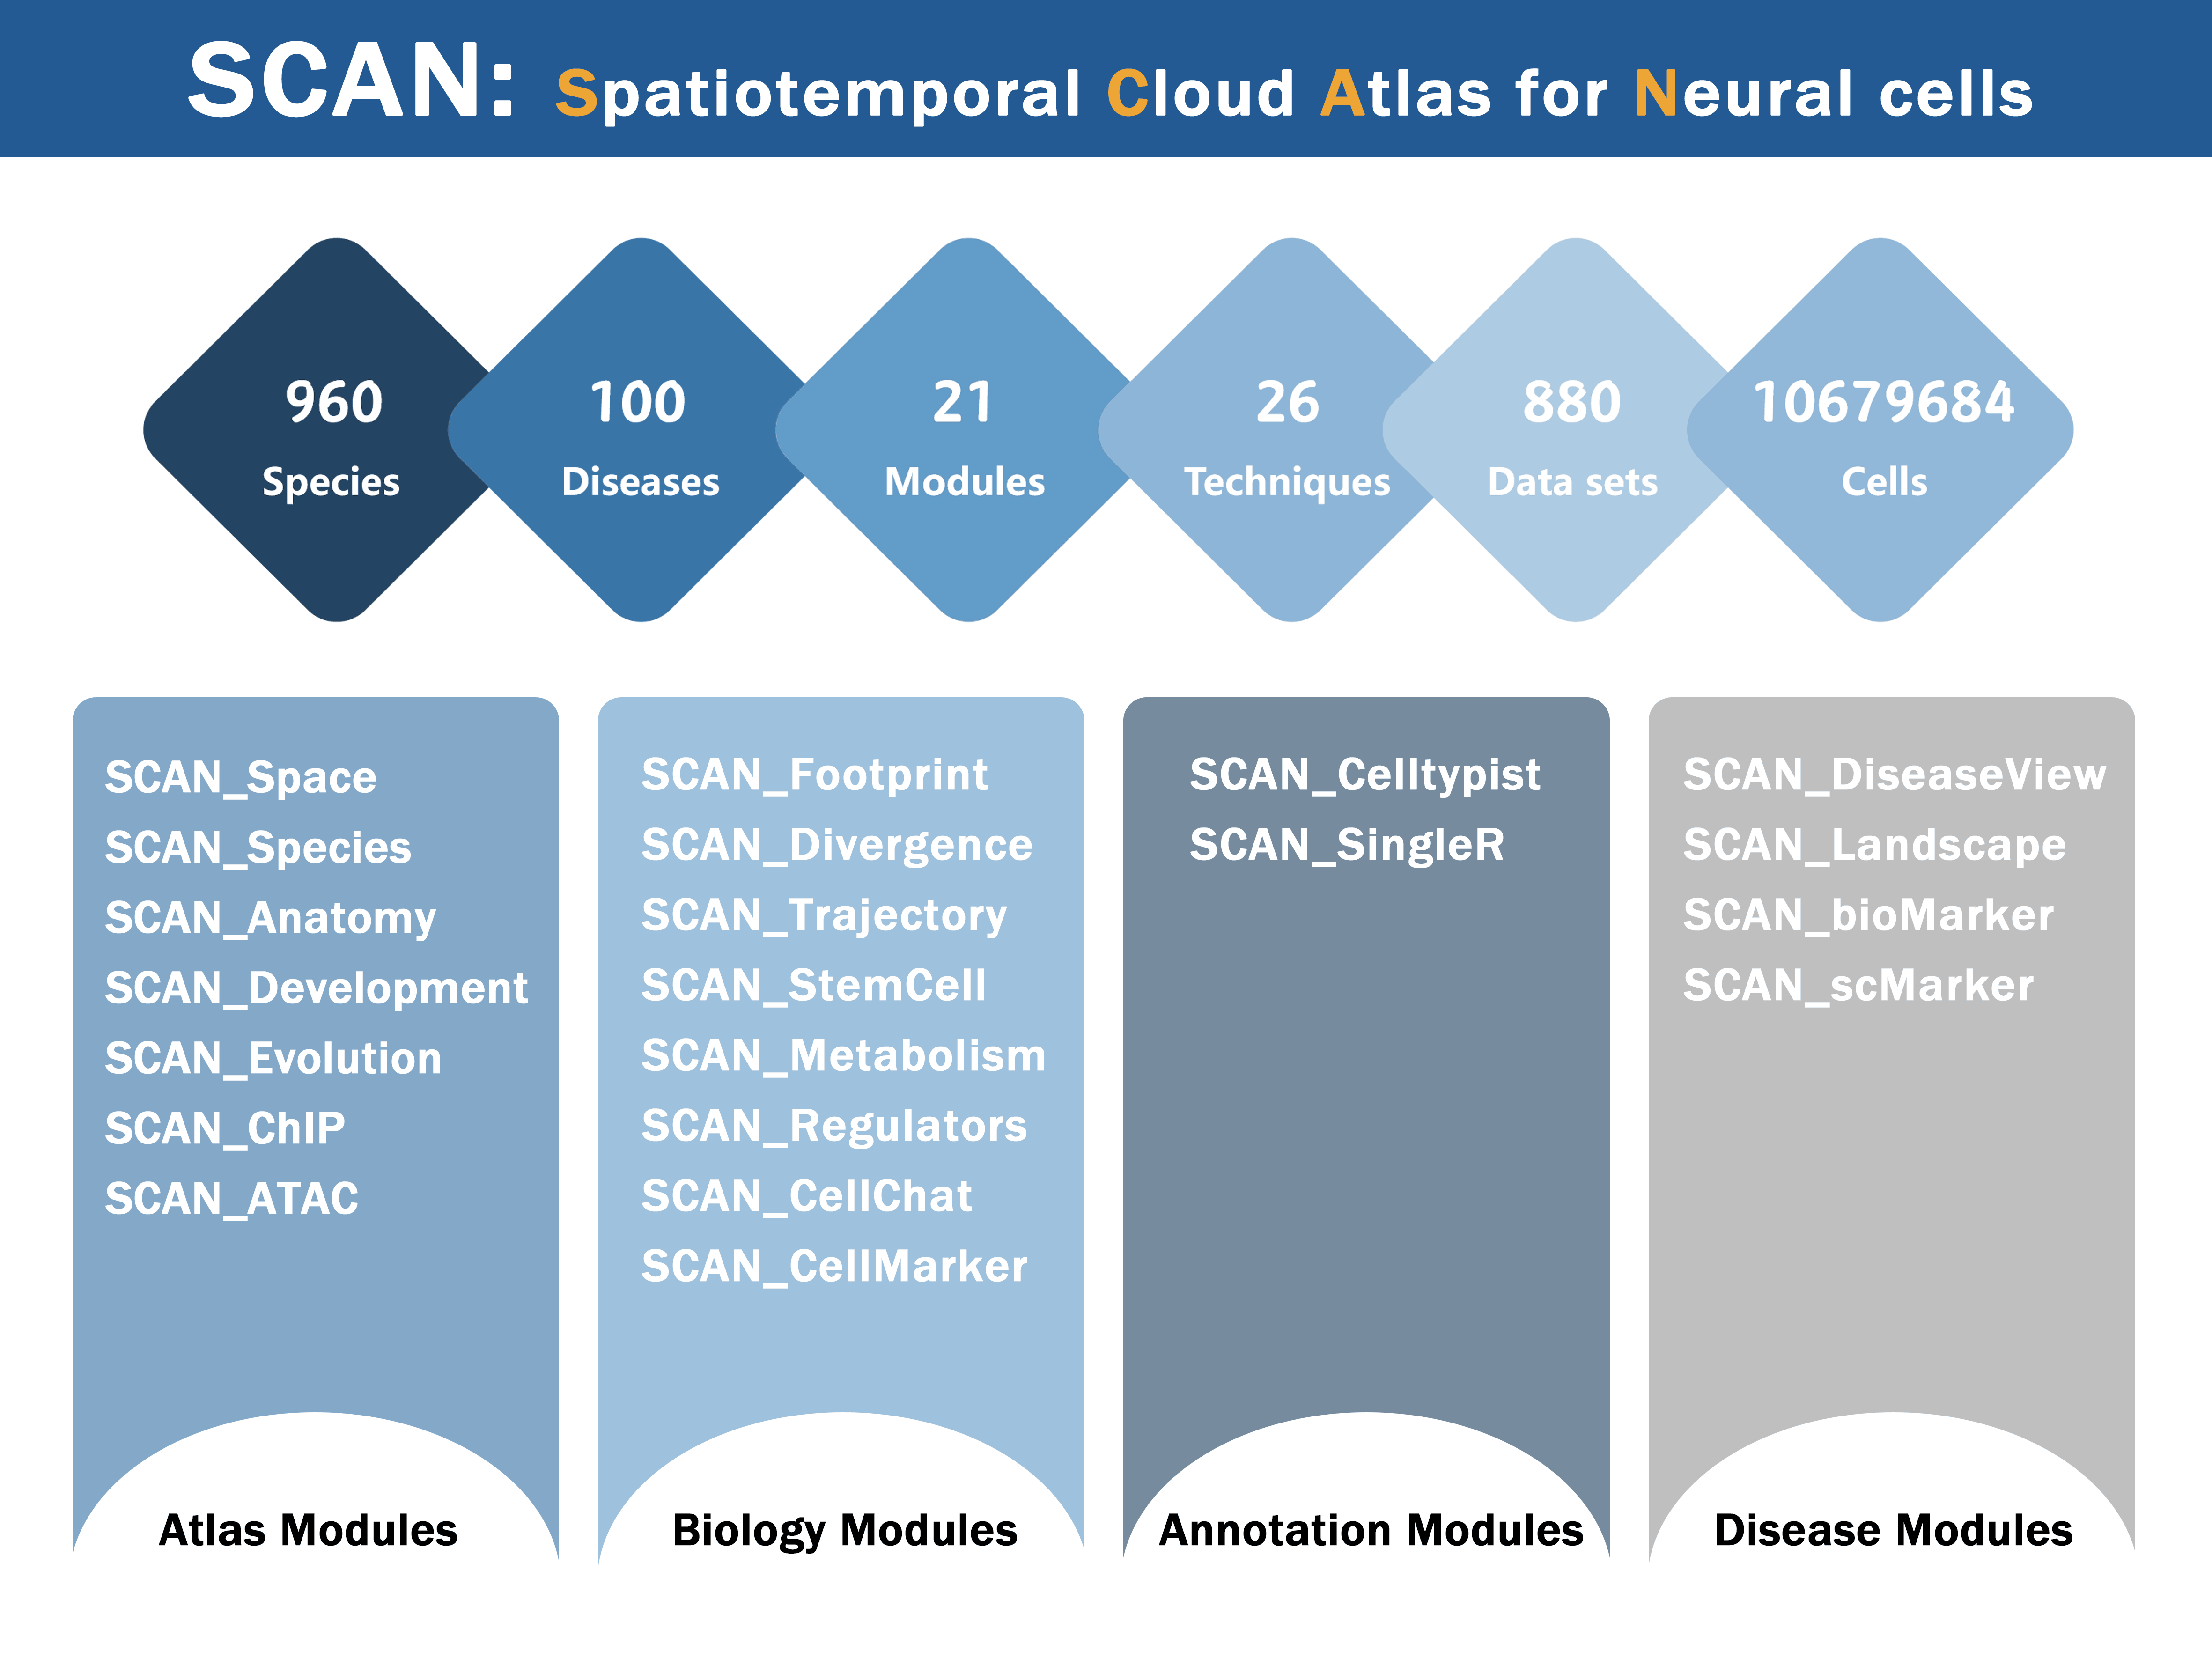
We collected and manually curated extensive nervous system sequencing data and developed a comprehensive, easily accessible, and user-friendly database (SCAN), thus providing a convenient and efficient data mining framework. Uniquely, the SCAN database combines both scRNA-seq and ST datasets for the nervous systems of multiple species, while also integrating genomic, and epigenetic data. Currently, SCAN includes scRNA-seq datasets of the nervous system of 67 species, as well as multiomics data of 900 species. The database is divided into four functional sections. The "Atlas Section" presents an expansive atlas of neural systems, detailing species-specific information, single-cell data, and spatially resolved transcriptomic, genomic, and transcription factor binding data. The "Biology Section" explores evolutionary aspects, developmental trajectories, stemness characteristics, metabolism, genetic regulatory networks, and cellular microenvironments of neural systems. The "Annotation Section" integrates tools, such as Celltypist and SingleR , for cell type annotation. The "Disease Section" provides a single-cell atlas of over 100 neural diseases, as well as disease fingerprint analysis and putative biomarker identification at the single-cell level. Overall, SCAN is a comprehensive database providing transformative information to facilitate advancements in neuroscience research.

ATLAS MODULES
ATLAS MODULES content goes here.
SCAN_Space
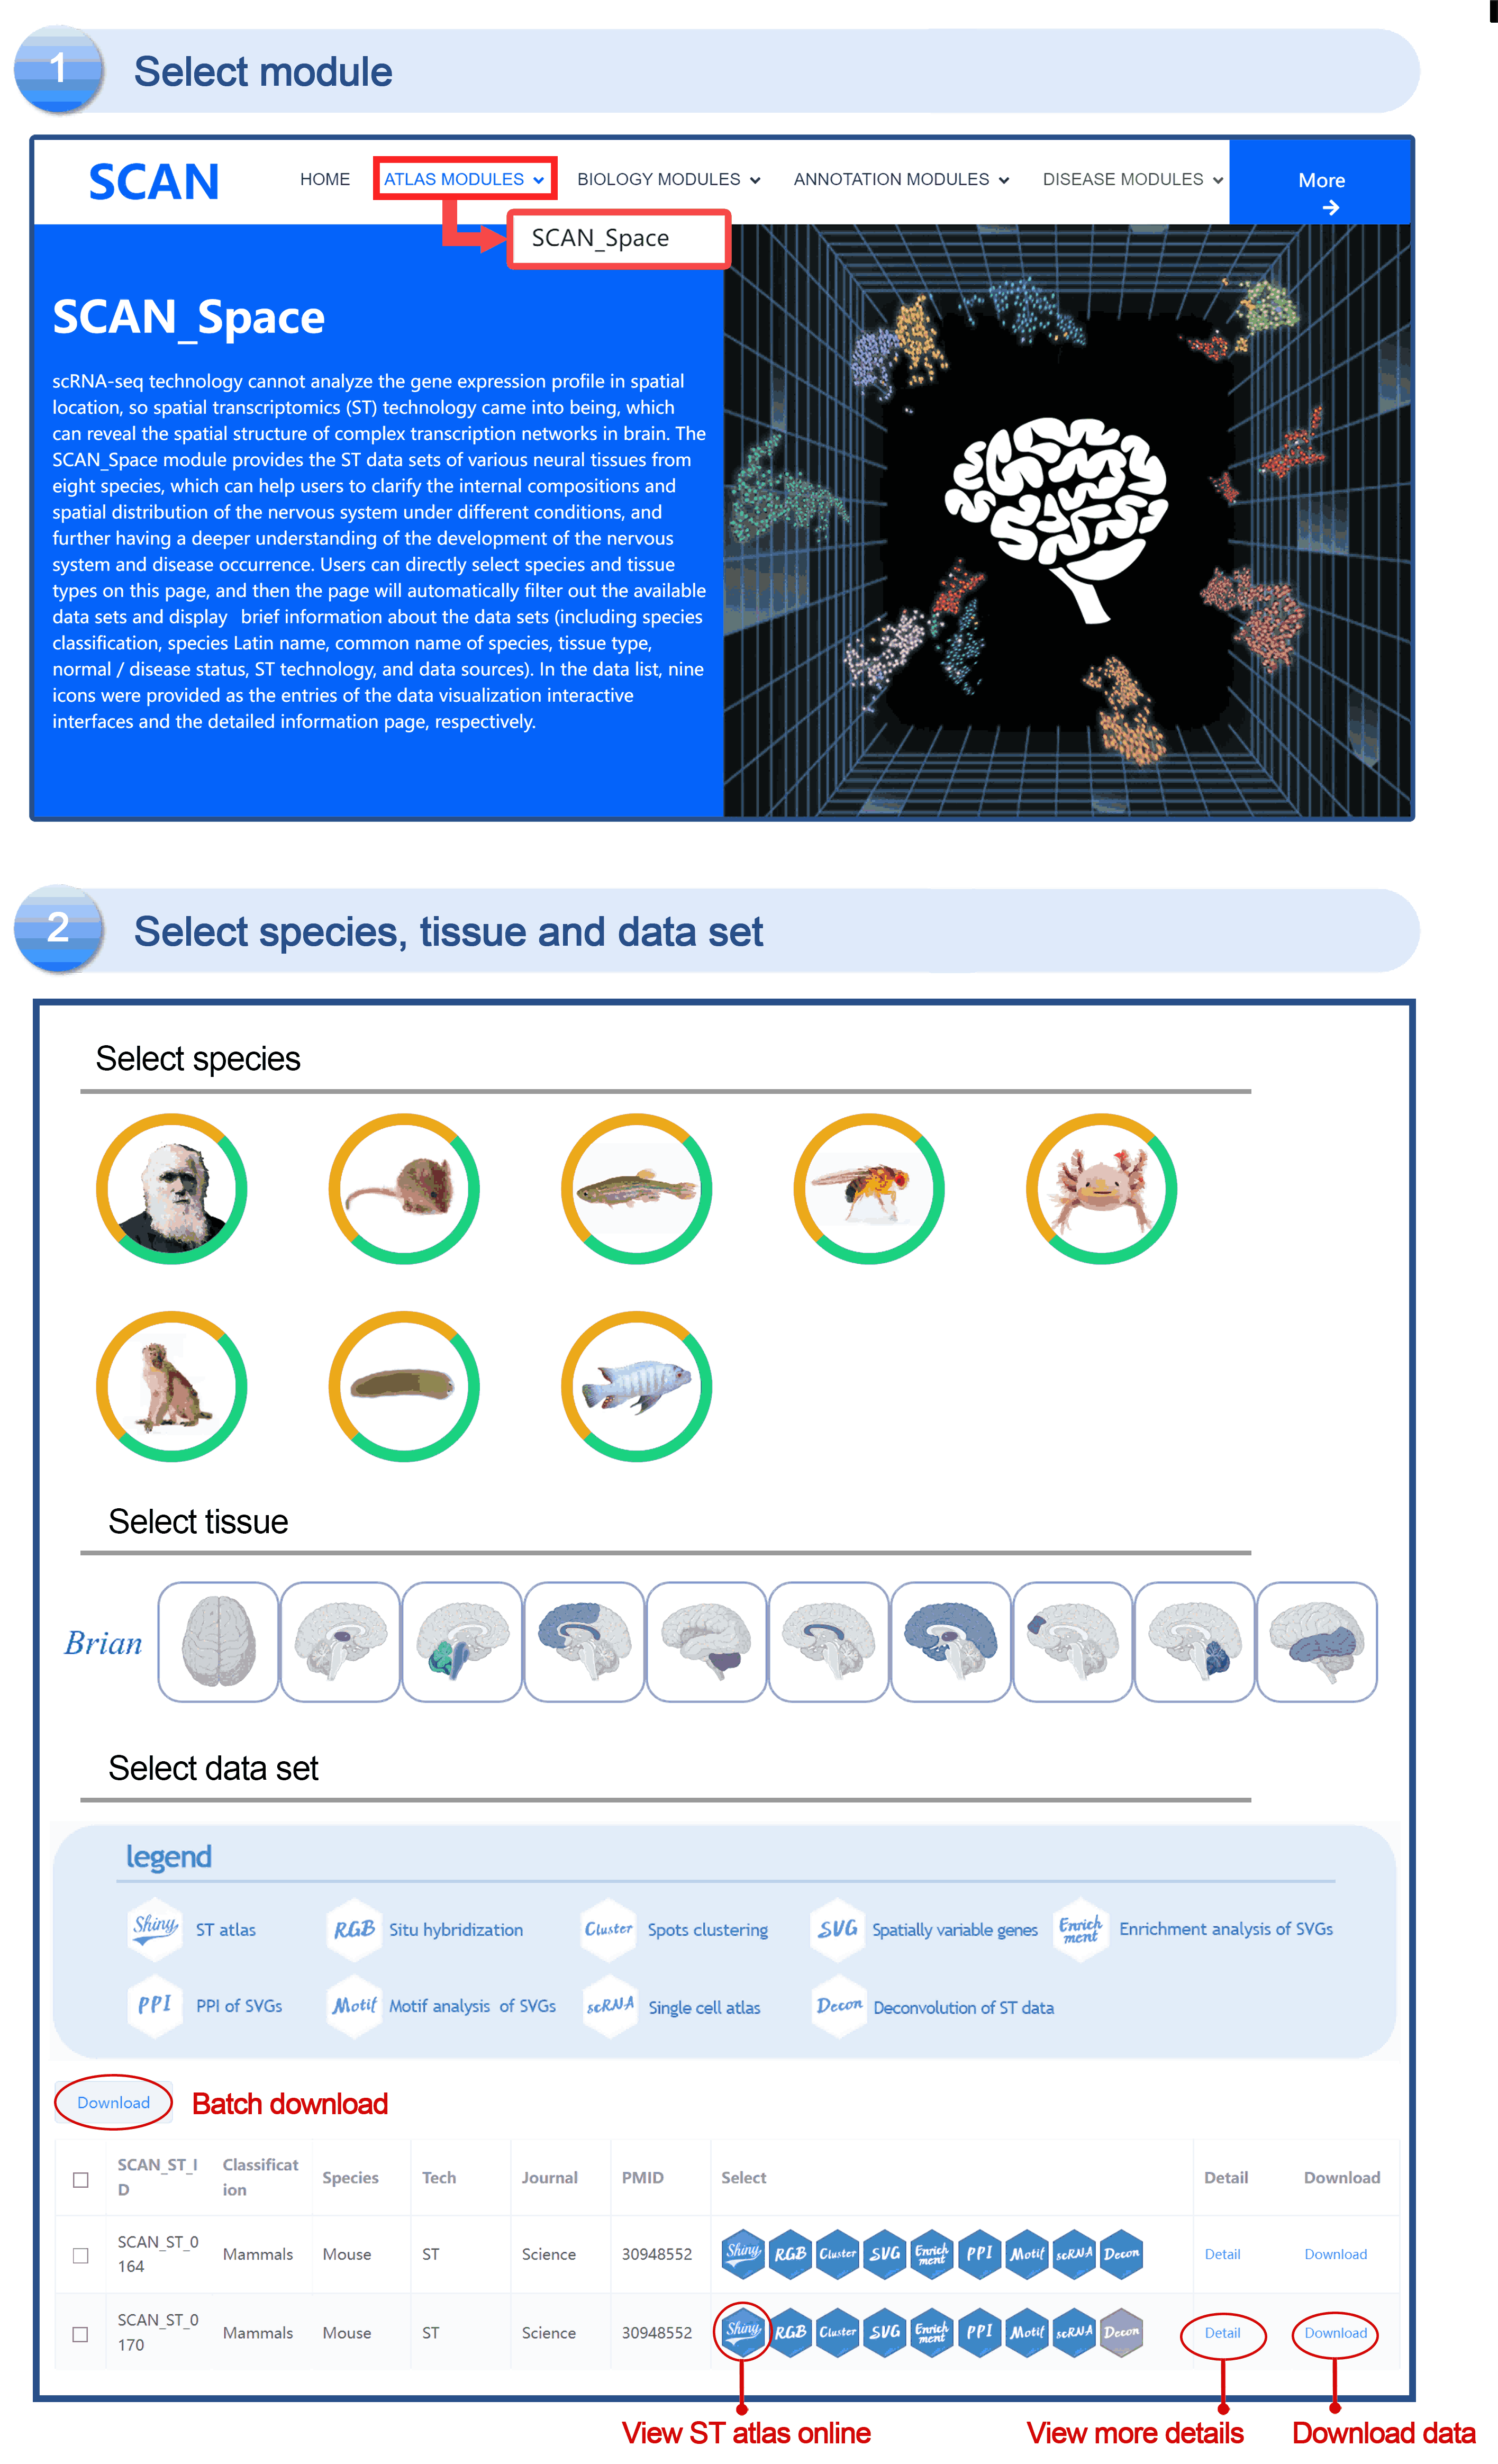
The "SCAN_Space" module allows users to explore the ST datasets of neural tissues from eight species (i.e., humans, mice, zebrafish, fruit flies, axolotls, freshwater planarians, and cynomolgus macaques) . Within this module, users can directly select specific species and tissue types. The page then refines and presents relevant details about the available datasets, including species classification, Latin and common names, tissue type, normal/disease status, ST methodology, and data sources. Within the data list, nine icons can be selected to direct the user to the data visualization interactive interface and detailed information page . By clicking the "Shiny" icon, users are directed to a fresh page where they can visually explore the expression profiles for genes of interest. Within this visualization framework, users have the capability to choose specific genes of interest from the selection box, which automatically pops up beneath "Select Gene". Additionally, users can fine-tune the size and transparency of image points through three adjustable sliding options, namely "Spot size" and "Alpha min/max". Upon selection, the "RGB" icon showcases the expression patterns of three independent genes, represented in red, green, and blue, respectively, which are subsequently merged on the same side to show co-expression patterns. The "Cluster" icon navigates to a section depicting the clustering of spatial spots, gene signatures of spatial clusters, and distribution of cluster marker genes. The "SVG" icon provides access to an overview table detailing spatially variable genes. For further exploration, "Enrichment" and "Motif" offer insights into gene list enrichment and motif enrichment for the SVGs. The "scRNA" icon leads users to a comprehensive single-cell atlas specific to the selected species. The "Decon" icon displays the deconvolution outcomes of the ST data, using a matched single-cell atlas as a reference. Finally, the "Detail" link allows users to browse detailed ST dataset information on a new page.
The data set of mouse hippocampus was selected, and the example data was SCAN_ST_0476. The Shiny icon shows the spatial expression profiles of all genes in this dataset. The RGB icon shows the expression patterns of the three independent genes in the data set, which are represented in red, green and blue, respectively, and then merged on the same side to show the co-expression pattern of the three independent genes. The " Cluster " icon shows the spatial point clustering, the gene characteristics of the spatial cluster, the expression pattern of the cluster marker gene, and the expression of the data set Top20 gene in different clusters. The " SVG " icon shows an overview of the dataset "s spatially variable genes. For further exploration, " Enrichment " and " Motif " provided gene list enrichment and motif enrichment of SVG. "PPI " shows the protein-protein interaction network of spatially variable genes in the dataset. "scRNA " can guide users into a comprehensive single-cell map for the selected data set species. "Decon " shows the deconvolution results of ST data, and uses the matched single cell map as a reference to infer the cell type in the space of this data set. Finally, the " Detail " link allows users to browse detailed ST dataset information on the new page.

SCAN_Species
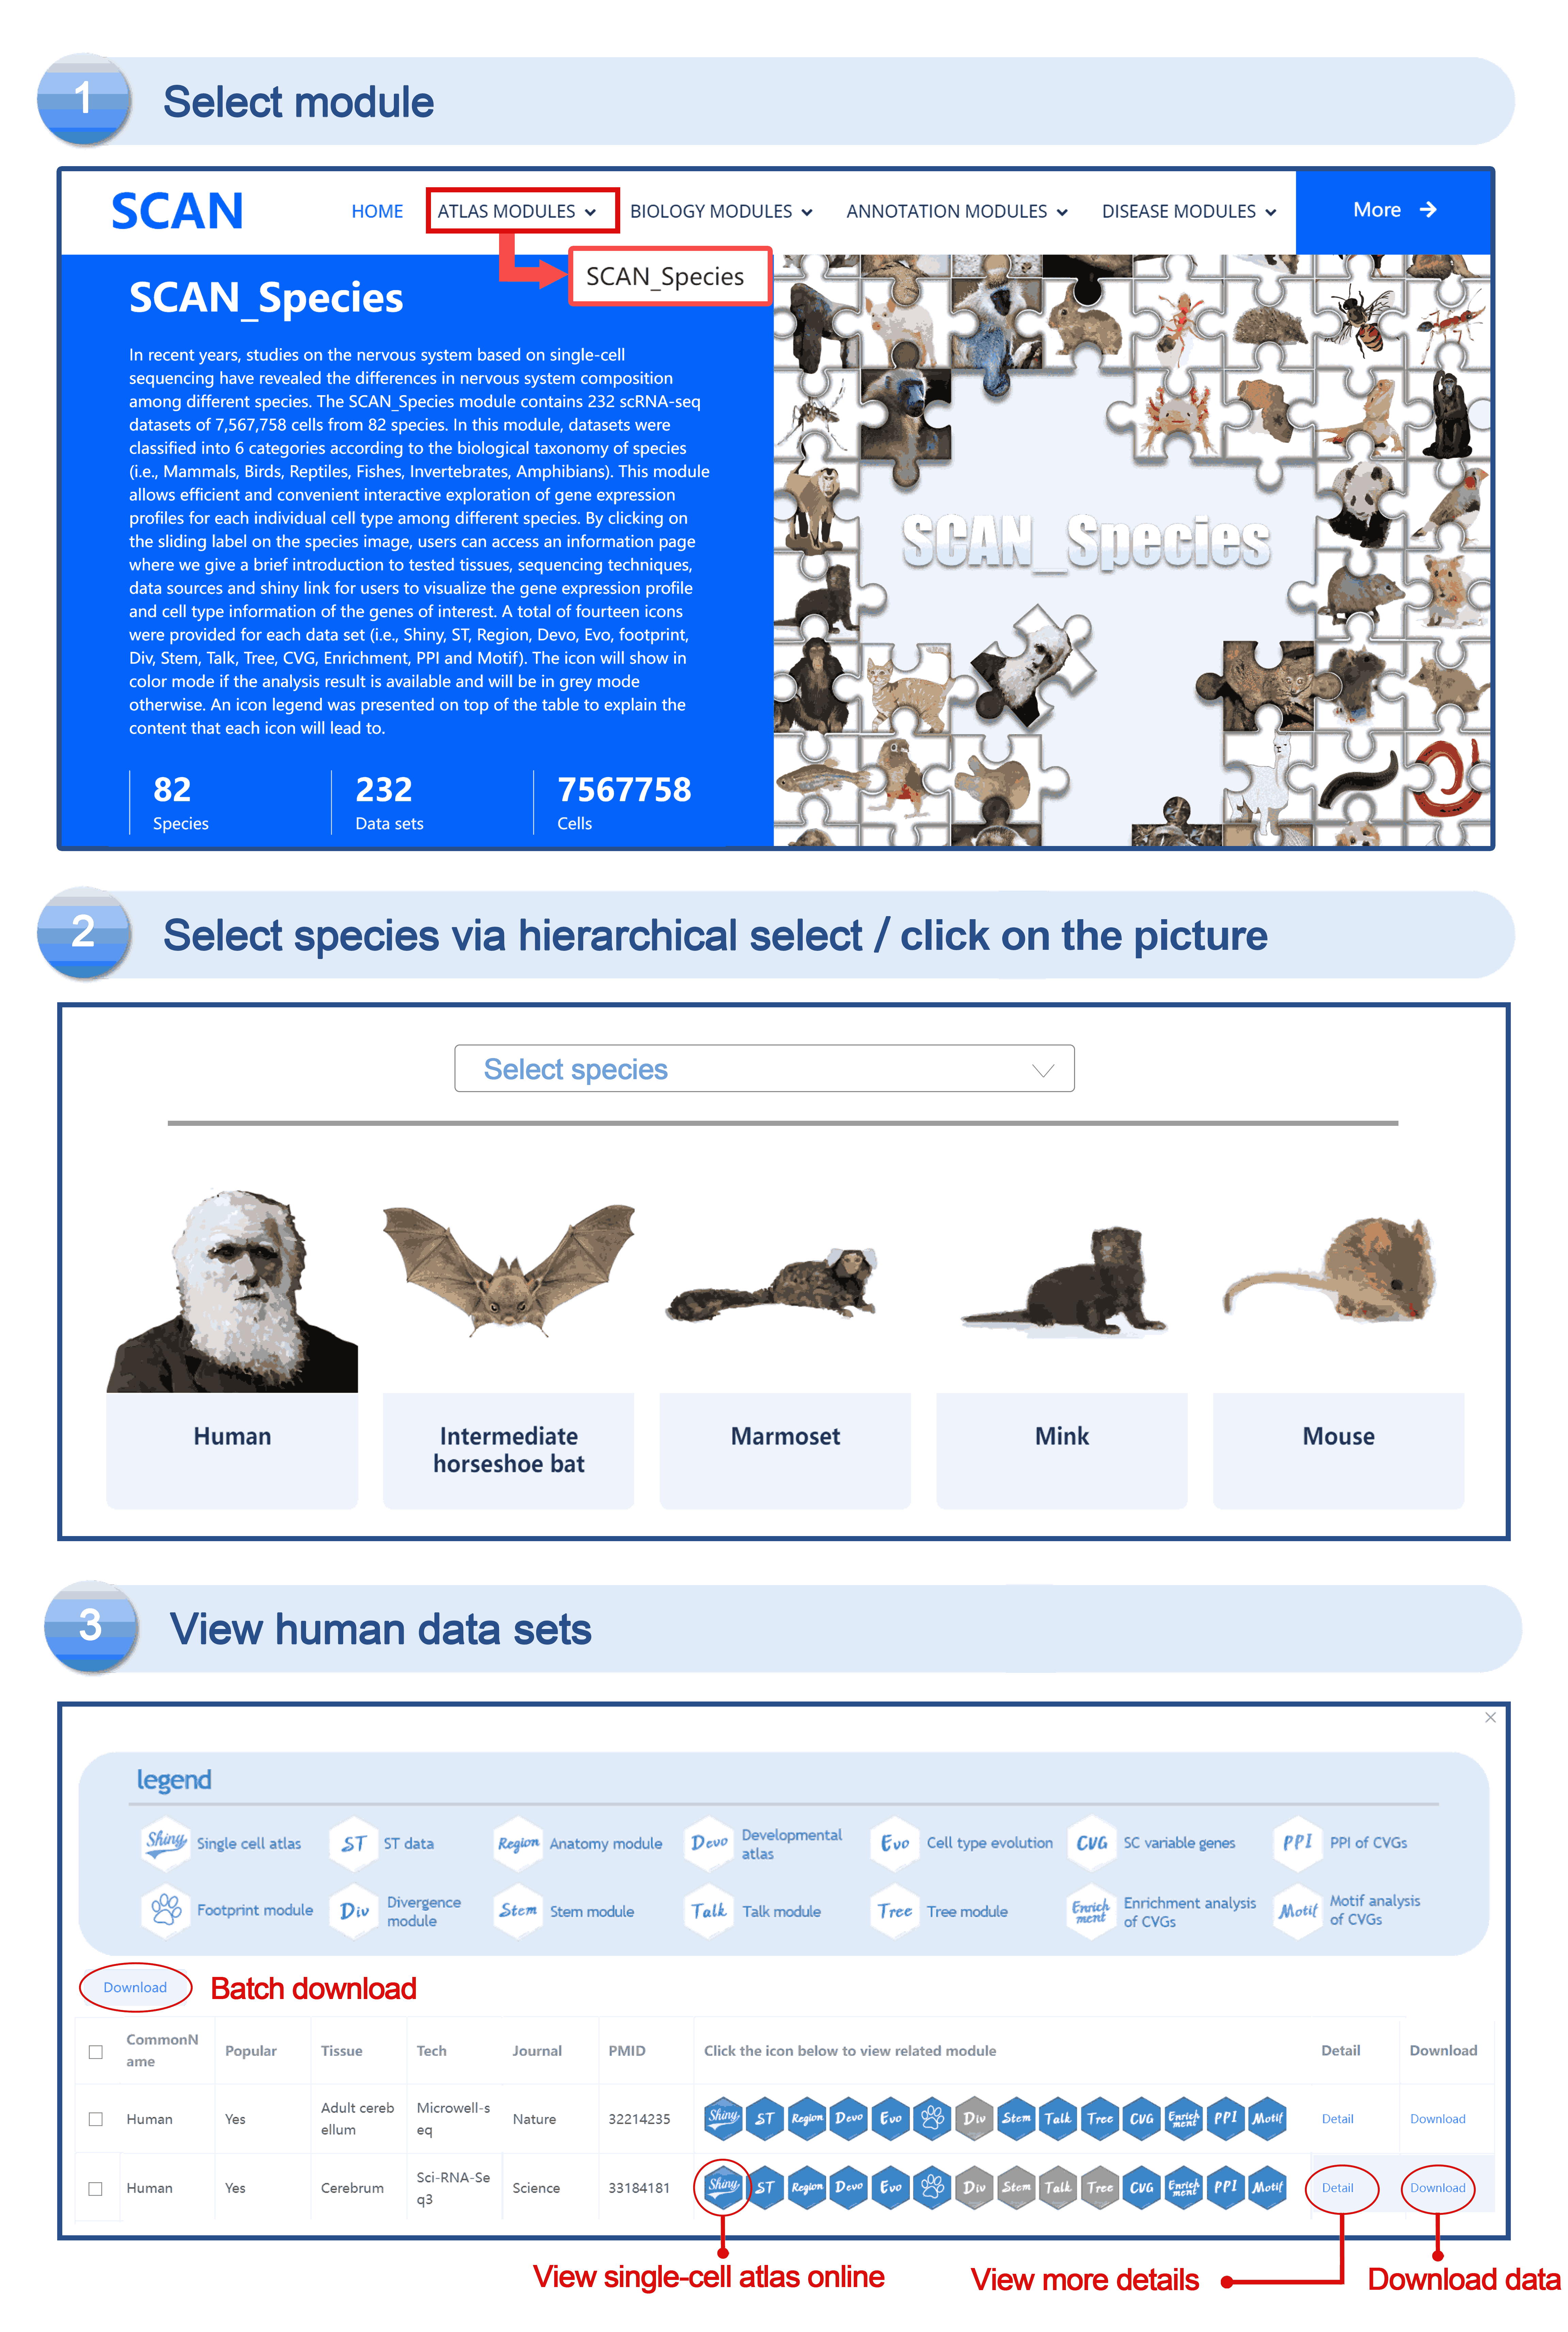
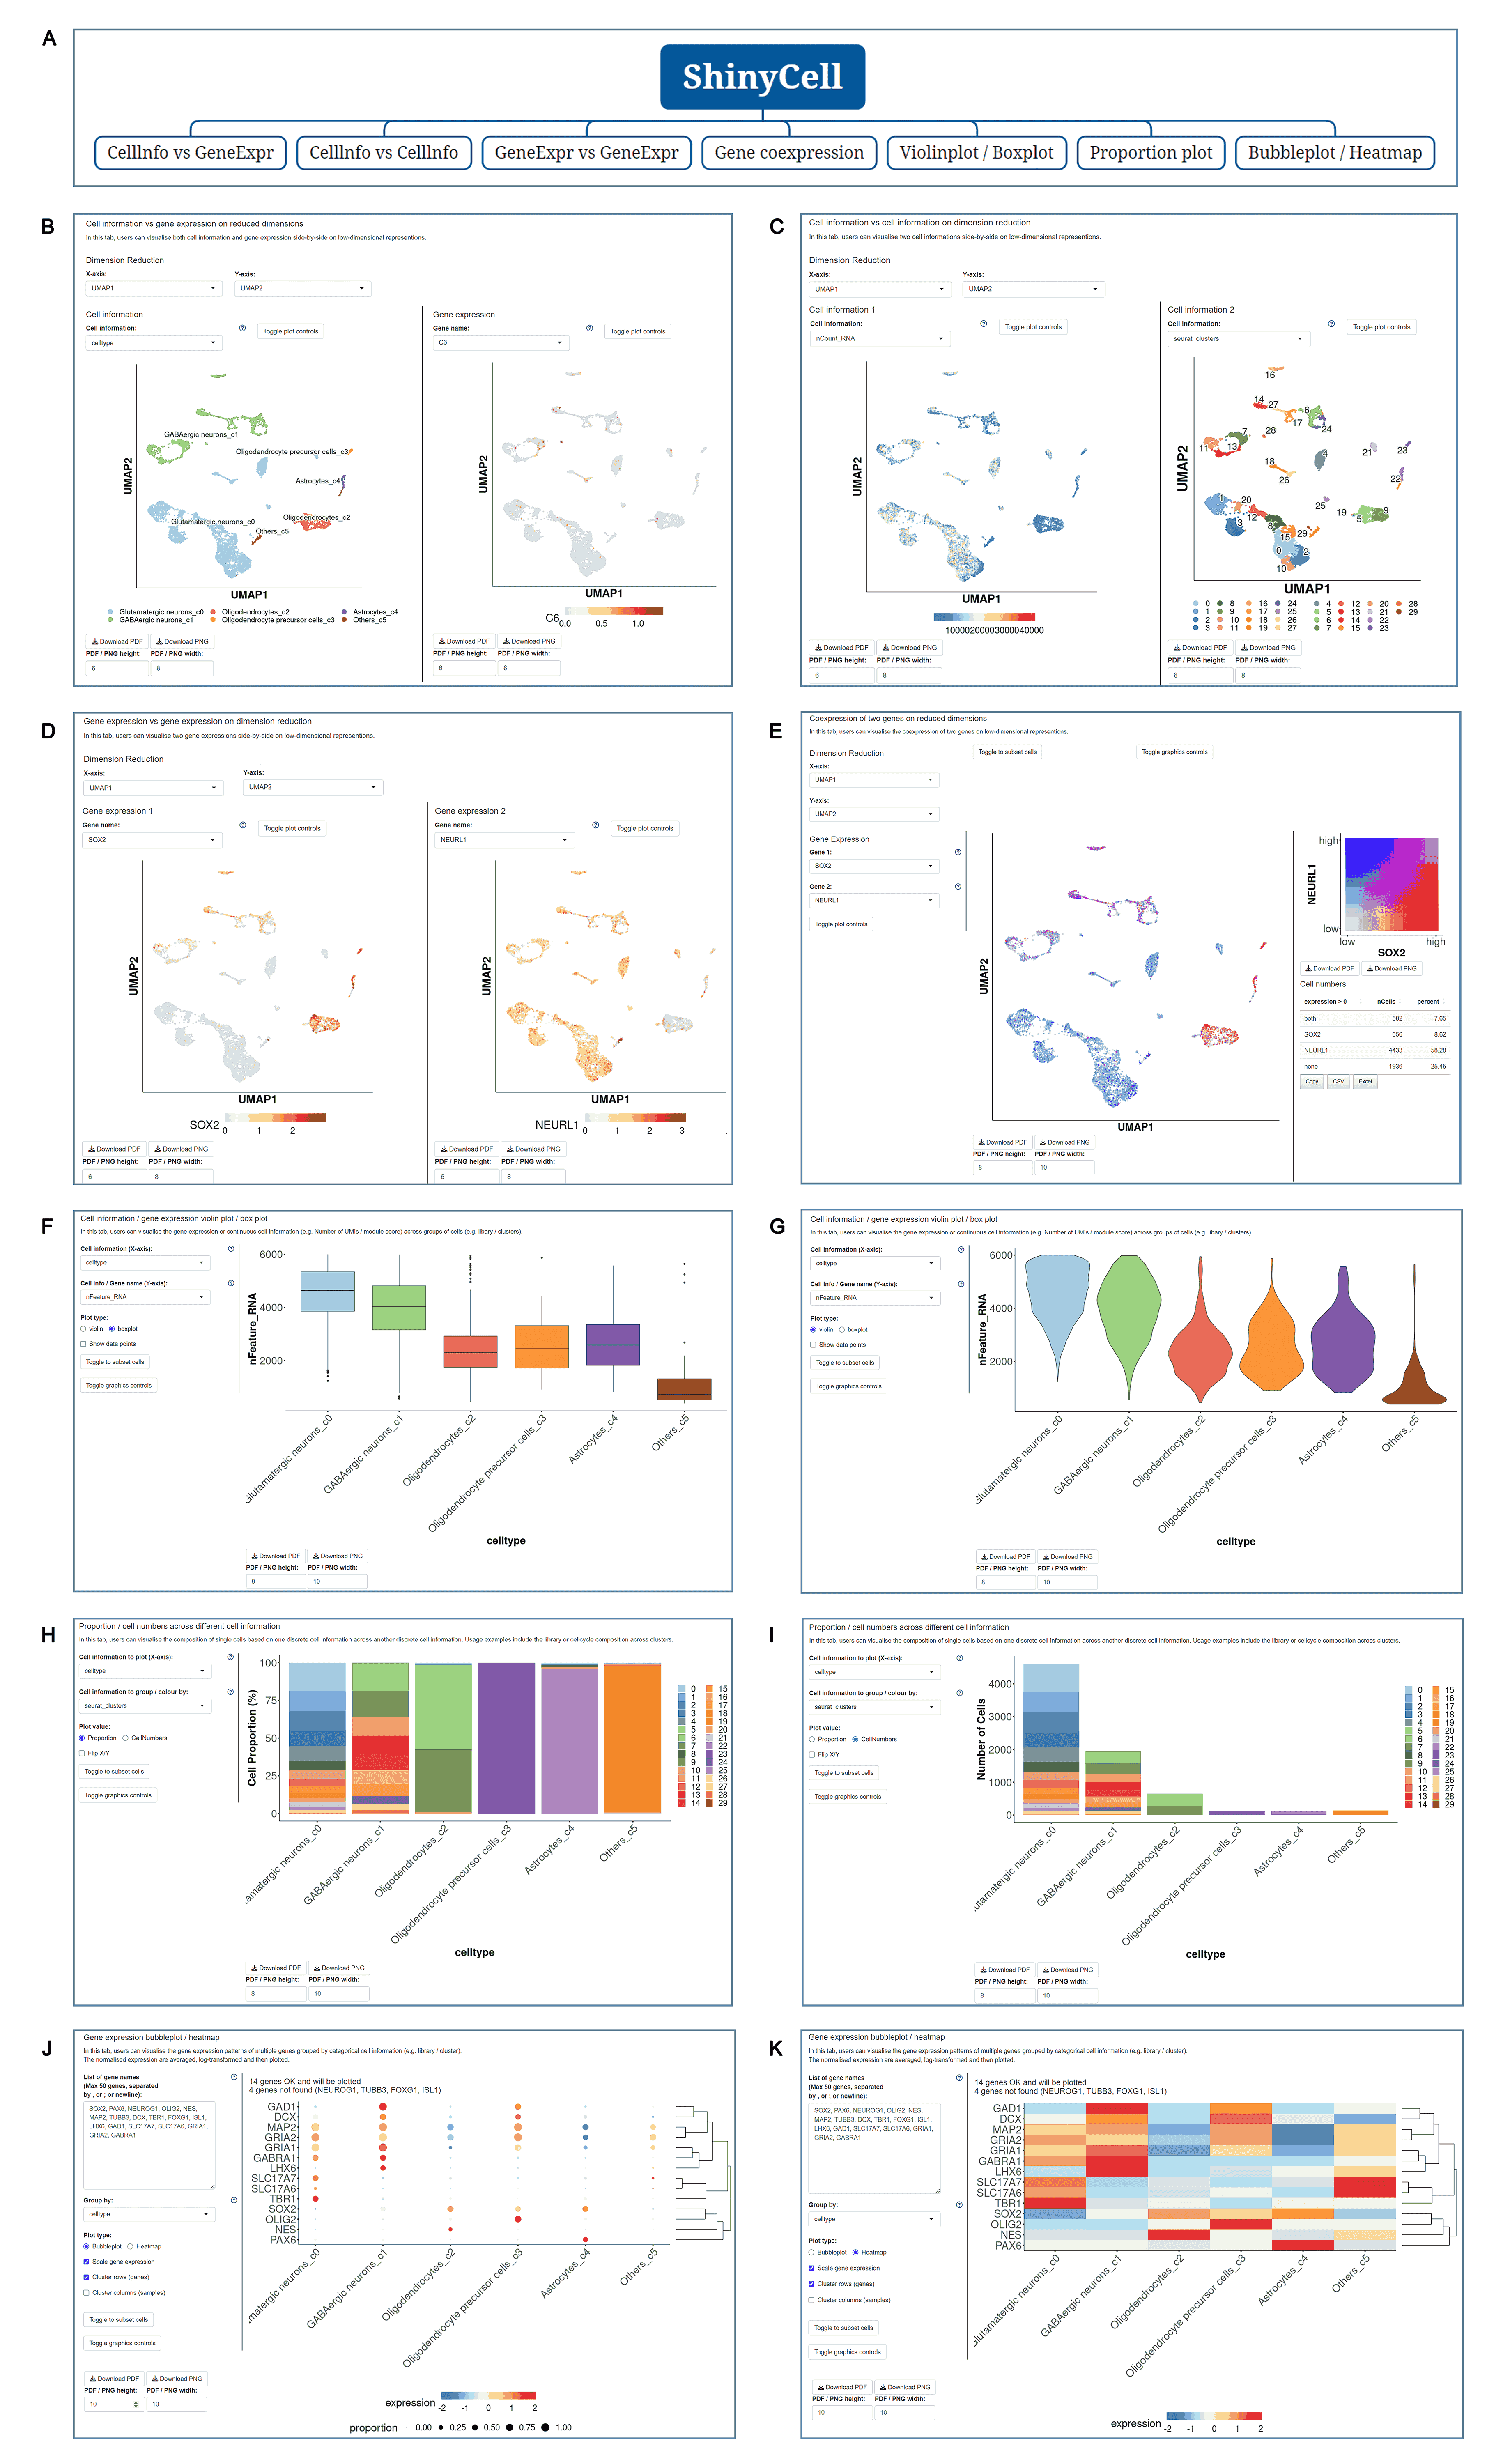
The "SCAN_Species" module contains the transcriptome data of 7,567,758 cells from 67 species (including mammals, birds, reptiles, amphibians, fishes, and invertebrates). The "SCAN_Species" module provides an efficient and convenient interactive platform for exploring gene expression profiles associated with each cell type . For users interested in investigating the expression profiles of genes of interest within specific cell types of distinct species, relevant information can be obtained via the following steps. Upon selecting "SCAN_Species", a sliding page appears, offering users three methods for species selection: visual image, common species name (black font), and Latin species name (blue font) . By selecting the sliding label associated with the species image, users are directed to an information page, which provides concise details regarding tissue types, sequencing techniques, and data sources, as well as two links ("ShinyLink" and "Detail") . Upon selecting the "Detail" link, users are directed to an information page where they can browse both basic species data and detailed single-cell map information , with the "Download" button enabling users to download relevant data. For each dataset, a total of 14 icons are provided (i.e., Shiny, ST, Region, Devo, Evo, Footprint, Div, Stem, Talk, , Tree, CVG, Enrichment, PPI, Motif) . The icon will be displayed in color if the analysis results are accessible; otherwise, it will appear in gray. To facilitate interpretation, an icon legend is positioned at the top of the table, detailing the content to which each icon corresponds. Alternatively, hovering the mouse over an icon triggers a pop-up reminder text. Upon selecting the "Shiny" link, users are directed to a new page with a seven-tab navigation menu . Here, users can further explore and visualize the gene expression profiles and cell type information of specific genes.
The data set of mice was selected, and the example data was SCAN_Pan_0035. After clicking the Shiny icon, it will enter a new page of this data set with a seven-tab navigation menu. The " CellInfo vs GenExpr " tab displays detailed information on cell and gene expression in a low-dimensional representation, such as the expression of genes of interest and their distribution in cell types and clusters. For example, the PLP1 gene is highly expressed in the Myelinating oligodendrocyte cell type. The " CellInfo vs CellInfo " tab helps to display information from two different types of cells side by side in a low-dimensional view, while the " GenExpr vs GenExpr " tab allows the gene expression data of two genes to be juxtaposed in a similar format. For example, the expression of genes " Gene1 " ( such as " SOX2 " ) and " Gene2 " ( such as " NEURL1 " ) can be observed simultaneously. Users can use the " Gene coexpression " function to explore the co-expression dynamics between two genes in a specific cell group or a single cell. The tool allows researchers to analyze the co-expression patterns of two genes of different cell types in the selected tissue. Users can simply select the desired genes from the " Gene coexpression " drop-down menu, such as " Gene1 " ( e.g., " SOX2 " ) and " Gene2 " ( e.g., " NEURL1 " ), to visualize their co-expression in a low-dimensional representation. The " ViolinPlot / BoxPlot " tab shows differences in gene expression or continuous cell information between different cell groups. The user only needs to select the corresponding information from the " Cell information ( X-axis ) " and " Cell Info / Gene name ( Y-axis ) " drop-down menus, and then select the required visualization format in " Plot type " to obtain the visualization results. The " Proportion plot " tab can be used to calculate the cell composition in a single cell dataset, and the display form can be selected by Plot value. "Bubbleplot / Heatmap " can visualize the expression of multiple genes in different cell classifications ( such as cell types and clusters ) in the form of bubble plots or heat maps. For example, GDF10 in the example gene is highly expressed in Astroglial cell-9. The " ST " icon directs the user to the page that displays the ST atlas of the investigated species. The " Region " icon directed the user to a single-cell map classified by anatomical structure. The " Devo " and " Evo " icons guide users to the developmental and evolutionary maps of the corresponding species, respectively. The " Footprint ", " Div ", " Stem ", " Talk " and " Tree " icons directed users to the " SCAN_Footprint ", " SCAN_Divergence ", " SCAN_Stem ", " SCAN_Talk " and " SCAN_Tree " modules, respectively. The " CVG " icon points to a table showing a list of variable genes for cell types ( such as " Myelinating oligodendrocyte " ), while the " Enrichment ", " PPI ", and " Motif " icons are linked to CVG "s gene list enrichment analysis, protein-protein interaction network, and transcription factor motif enrichment.

SCAN_Anatomy
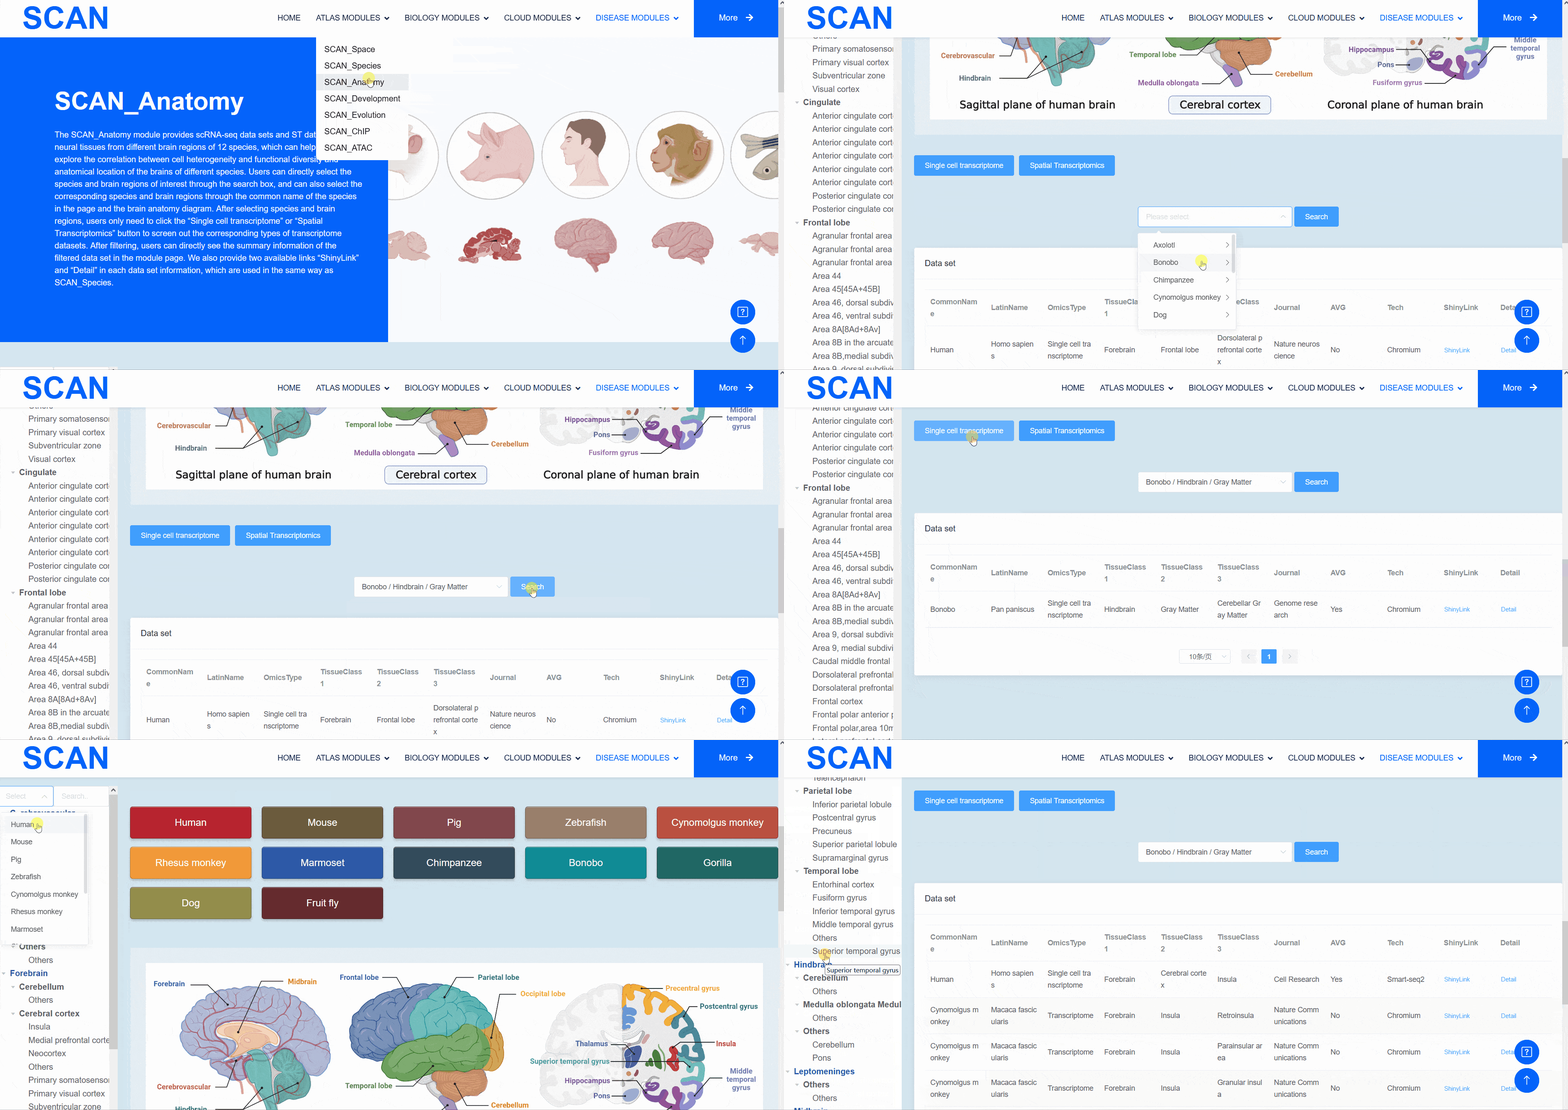
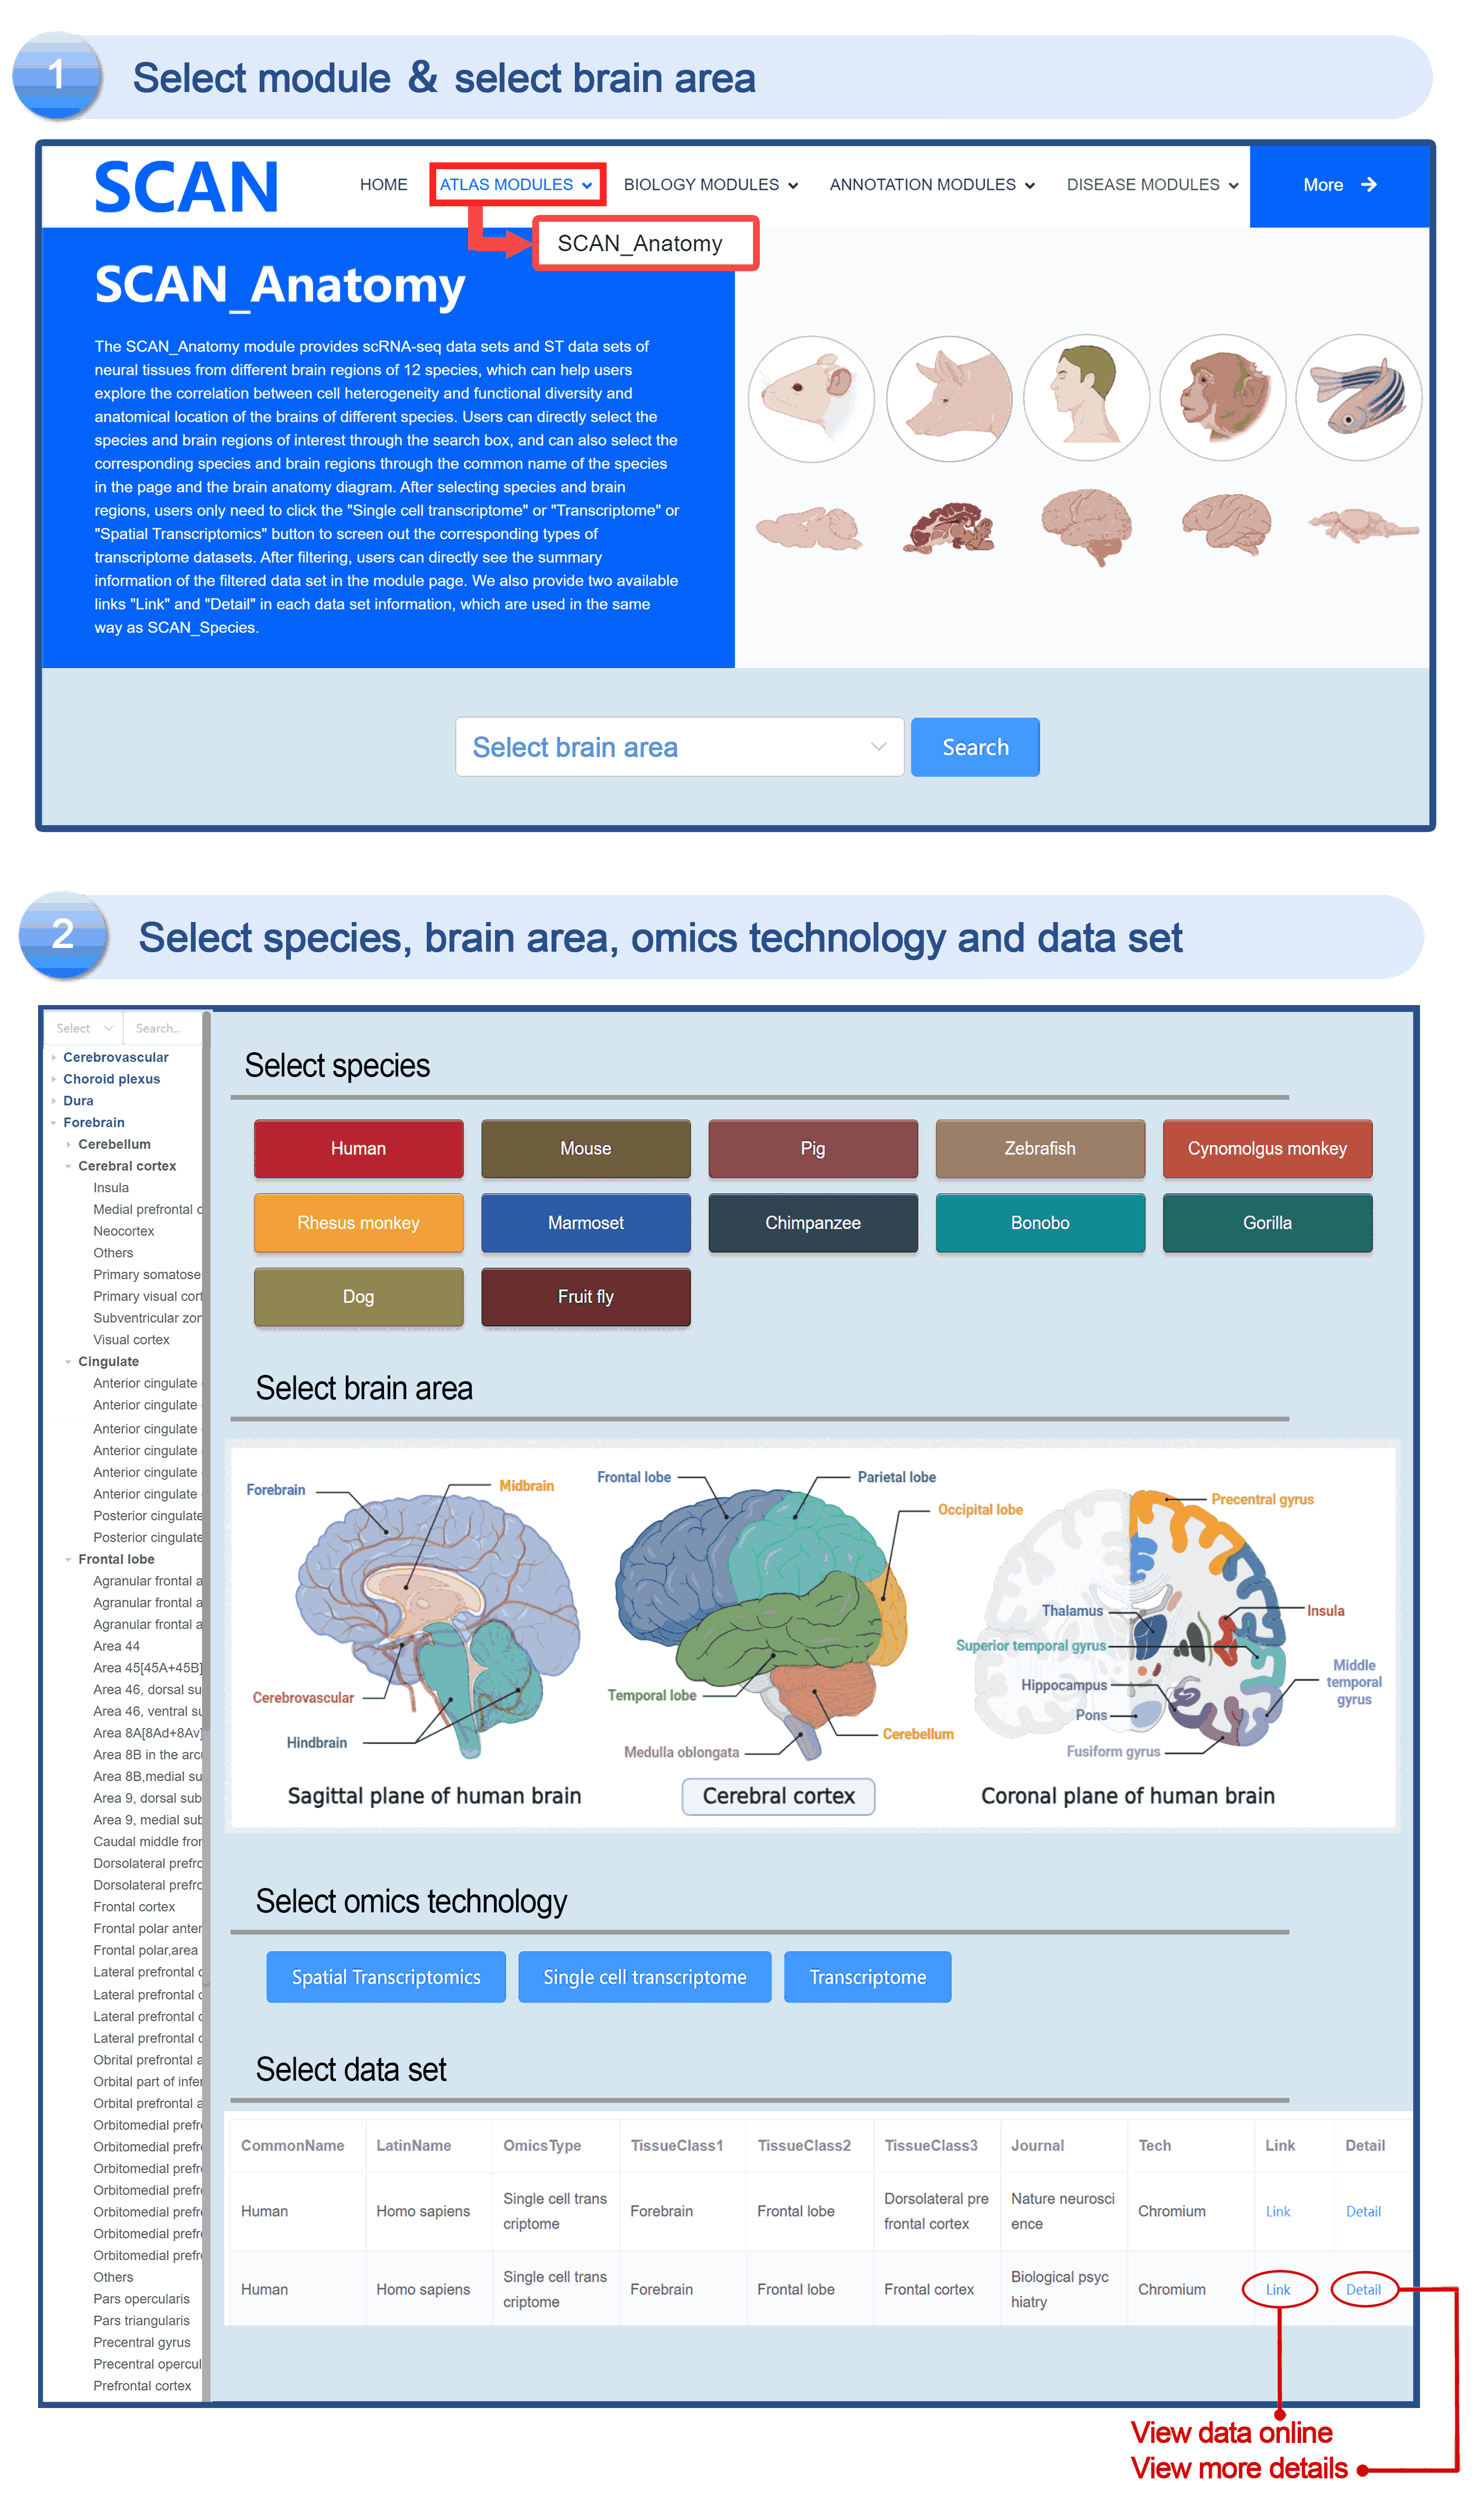
The "SCAN_Anatomy" module displays scRNA-seq and ST datasets of neural tissues across various brain regions from 12 species. The module allows users to explore the relationships among cell heterogeneity, functional diversity, and anatomical location within the brains of different species. Users can directly select the species and brain regions of interest through the search box and subsequently select the species and brain regions via labeled buttons displaying the common species name and brain anatomy diagrams . A tree-view navigation bar is presented on the left side of the webpage, providing a hierarchical view of brain structure taxonomy . Once a species and region are selected, the "Single-cell transcriptome" and "Spatial Transcriptomics" buttons allow users to narrow down the specific transcriptome dataset type. After filtering, users can promptly access a summary of the filtered dataset on the module page. Analogous to the "SCAN_Species" module, each dataset is provided with "ShinyLink" and "Detail" links for further exploration.
The human frontal cortex data set is selected, and the example data is SCAN_Anatomy_0002. Clicking on Link will take you to the new page of this dataset with a seven-tab navigation menu. The " CellInfo vs GenExpr " tab displays detailed information on cell and gene expression in a low-dimensional representation, and can view the gene expression of interested genes and their distribution in cell types, clusters, etc. For example, the C3 gene is highly expressed in FC-MG cell types. The " CellInfo vs CellInfo " tab helps to display information from two different types of cells side by side in a low-dimensional view, while the " GenExpr vs GenExpr " tab allows the gene expression data of two genes to be juxtaposed in a similar format. For example, the expression of genes " Gene1 " ( such as " SOX2 " ) and " Gene2 " ( such as " NEURL1 " ) can be observed simultaneously. "Gene coexpression "can be used to explore the co-expression kinetics between two genes in a specific cell group or a single cell. The tool allows users to analyze the co-expression patterns of two genes of different cell types in the selected tissue. Users can simply select the desired genes from the " Gene coexpression " drop-down menu, such as " Gene1 " ( e.g., " SOX2 " ) and " Gene2 " ( e.g., " NEURL1 " ), to visualize their co-expression in a low-dimensional representation. The " ViolinPlot / BoxPlot " tab can show the differences in gene expression or continuous cell information between different cell groups, such as the low expression of cell type " FC-N-undef " in this dataset. Users only need to select the corresponding information from the " Cell information ( X-axis ) " and " Cell Info / Gene name ( Y-axis ) " drop-down menus to select the desired visualization format in " Plot type " to obtain visualization results. The " Proportion plot " tab can be used to calculate the cell composition in the single-cell dataset. For example, " Cell information ( X-axis ) " selects sample and " Cell Info / Gene name ( Y-axis ) " selects celltype. It can be observed that the proportion of cell types in the three samples of this dataset is different. The " Bubbleplot / Heatmap " tab can visualize the expression of multiple genes in different cell types ( such as cell types and clusters ) using bubble plots or heat maps. For example, SPP1 in the example gene is highly expressed in the cell type FC-MG. Finally, the " Detail " link allows users to browse detailed dataset information on a new page.
SCAN_Development
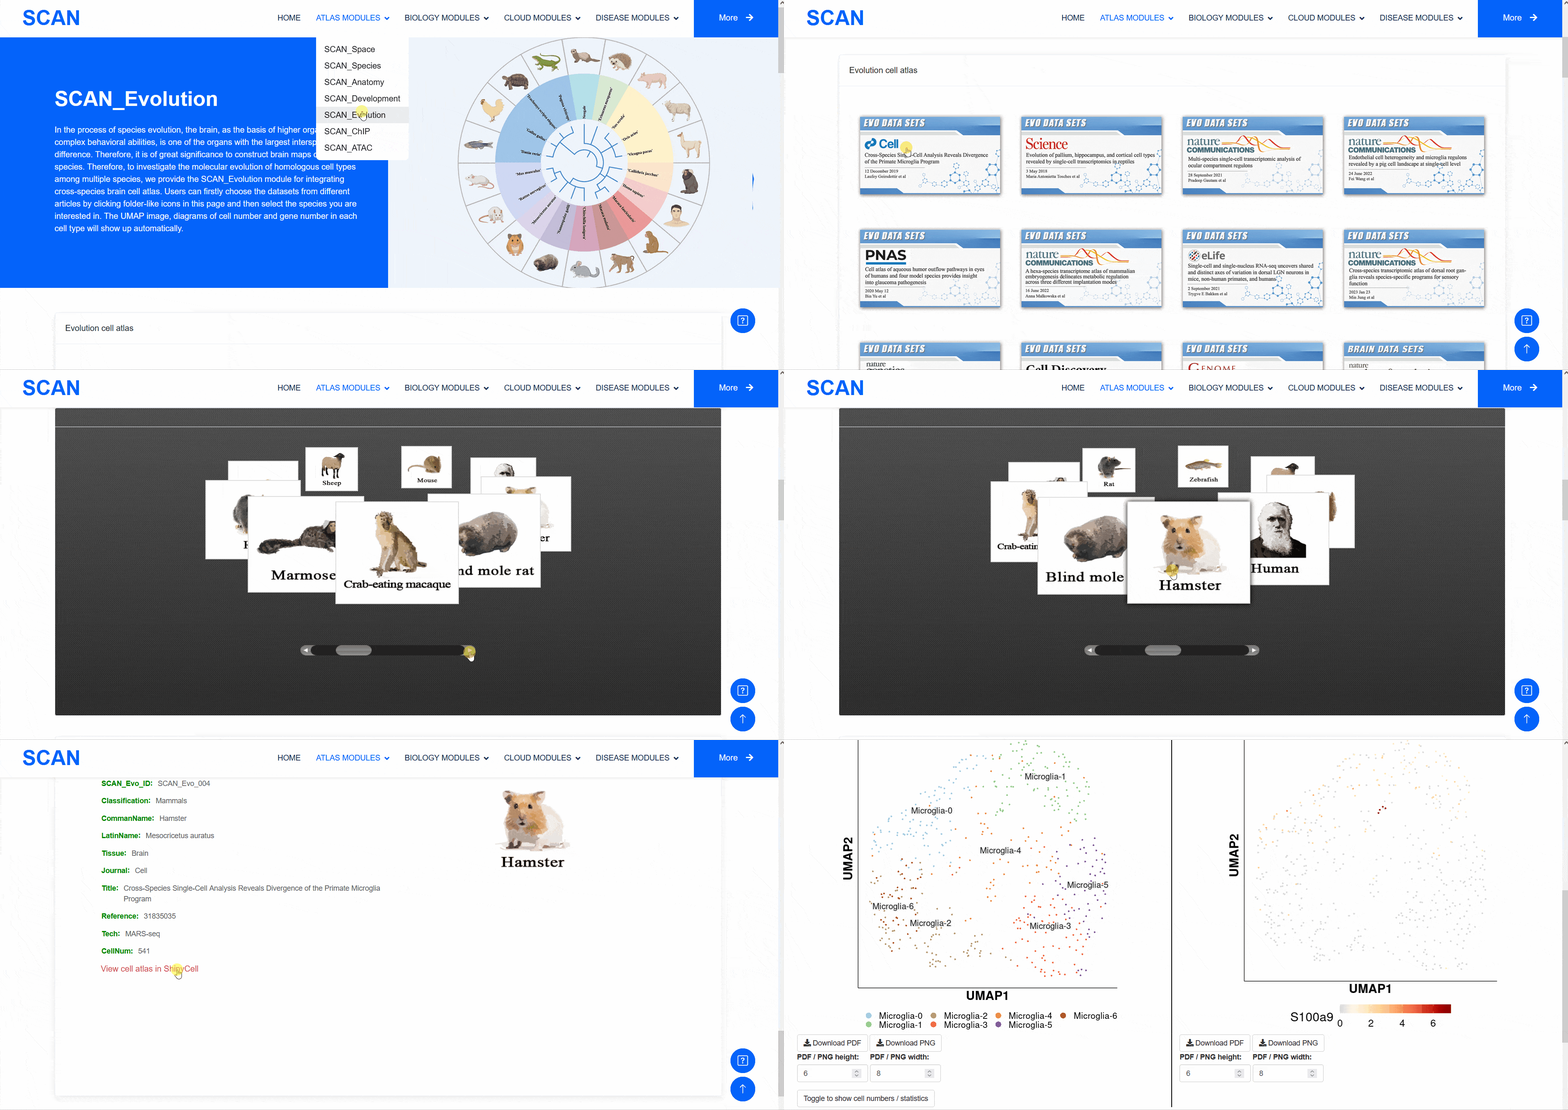
The "SCAN_Development" module integrates the developmental neural cell atlases of 20 species (i.e., Homo sapiens, Danio rerio, Xenopus tropicalis, Caenorhabditis elegans, Drosophila melanogaster, Branchiostoma floridae, Ciona robusta, Strongylocentrotus purpuratus, Mus musculus, Oryctolagus cuniculus, Gallus gallus, Macaca fascicularis, Ciona intestinalis, Sus scrofa, Xenopus laevis, Monodelphis domestica, Ambystoma mexicanum, Schmidtea mediterranea, Hofstenia miamia, Macaca mulatta). Upon accessing the module, users can select the species of interest based on the illustrative images provided. After this, UMAP images of each developmental period of the chosen species are displayed at the bottom of the page. When the cursor is moved to the corresponding UMAP, dataset information detailing the developmental period becomes visible, accompanied by a "View more" link for further exploration. Clicking on the link directs users to a new page containing detailed information about the dataset. Additionally, a "View cell atlas in ShinyCell" link is highlighted in red. Upon selecting this link, users are redirected to a data visualization interactive page. Given the evolutionary trajectory of species, the brain exhibits highly distinct interspecies variations, especially in advanced organisms with sophisticated behavioral traits. Therefore, the "SCAN_Evolution" module, which integrates cross-species brain cell atlases, provides the ability to explore the molecular evolution of homologous cell types among multiple species.
The mouse dataset " Systematic identification of cell-fate regulatory programs using a single-cell atlas of mouse development " was selected, and UMAP images of each developmental stage of the species were displayed at the bottom of the page. When the cursor moves to the corresponding UMAP, the data set information detailing the development period will become visible, with a " View more " link for further exploration. Clicking the link will direct the user to a new page with dataset details. In addition, the " View cell atlas in ShinyCell " link is highlighted in red. After clicking this link, the user will enter a new page with a seven-tab navigation menu. In order to better demonstrate the function of the module, SCAN_Dev_064 is selected as the sample data for the following demonstration. The " CellInfo vs GenExpr " tab displays detailed information on cell and gene expression in a low-dimensional representation, such as the gene expression of the gene of interest and its distribution in cell types, clusters, etc. For example, the Ttr gene is highly expressed in Neuron-14 cell types. The " CellInfo vs CellInfo " tab helps to display information from two different types of cells side by side in a low-dimensional view, while the " GenExpr vs GenExpr " tab allows the gene expression data of two genes to be juxtaposed in a similar format. For example, the expression of genes " Gene1 " ( such as " Ttr " ) and " Gene2 " ( such as " Hbb-bt " ) can be observed simultaneously. In order to explore the co-expression dynamics between two genes in a specific cell group or a single cell, users can use the " Gene coexpression " function. The tool allows users to analyze the co-expression patterns of two genes of different cell types in selected tissues. Users can simply select the desired genes from the " Gene coexpression " drop-down menu, such as " Gene1 " ( e.g., " Ttr " ) and " Gene2 " ( e.g., " Hbb-bt " ), to visualize their co-expression in a low-dimensional representation. The " ViolinPlot / BoxPlot " tab can show the differences in gene expression or continuous cell information between different cell groups in the form of violin plots and box plots. For example, the cell type " Neuron-0 " in this data set has low expression. The user only needs to select the corresponding information from the " Cell information ( X-axis ) " and " Cell Info / Gene name ( Y-axis ) " drop-down menus, and then select the required visualization format in " Plot type " to obtain the visualization results. The " Proportion plot " tab can be used to calculate the cell composition in the single-cell dataset, such as " Cell information ( X-axis ) " selection stage and " Cell Info / Gene name ( Y-axis ) " selection celltype. It can be observed that the proportion of cell types in each stage of this dataset is different. The " Bubbleplot / Heatmap " tab can visualize the expression of multiple genes in different cell types ( such as cell types and clusters ) in the form of bubble plots or heat maps. For example, Lhx9 in the example gene is highly expressed in the cell type Neuron-9. "List of TVGs " showed an overview of time-varying genes in the dataset, while " Toppgen enrichment analysis of TVGs ", " PPI analysis of TVGs ", and " Motif enrichment analysis of TVGs " showed gene list enrichment analysis, protein-protein interaction network, and transcription factor motif enrichment of TVG.

SCAN_Evolution
Therefore, the "SCAN_Evolution" module, which integrates cross-species brain cell atlases, provides the ability to explore the molecular evolution of homologous cell types among multiple species.
Select " Mammals evolution dataset " in " Evolution cell atlas " to see UMAP images of all species data contained in this dataset and images of cell number and gene number of each cell type. Select a species of interest ( e.g. humans ) and " Info " provides access to detailed dataset information. In addition, the " View cell atlas in ShinyCell " link is highlighted in red. Click on this link to enter a new page with a seven-tab navigation menu, and use the corresponding tab to further analyze the data set ( sample data SCAN_Evo_102 ). The " CellInfo vs GenExpr " tab displays detailed information of cell and gene expression in a low-dimensional representation. Users can use this tab to view the gene expression of interested genes and their distribution in cell types, clusters, etc. For example, the COL1A2 gene is highly expressed in the Stromal cell type. The " CellInfo vs CellInfo " tab helps to display information from two different types of cells side by side in a low-dimensional view, while the " GenExpr vs GenExpr " tab allows the gene expression data of two genes to be juxtaposed in a similar format. For example, the expression of genes " Gene1 " ( such as " TTR " ) and " Gene2 " ( such as " SPP1 " ) can be observed simultaneously. In order to explore the co-expression dynamics between two genes in a specific cell group or a single cell, users can use the " Gene coexpression " function. The tool allows users to analyze the co-expression patterns of two genes of different cell types in selected tissues. Users can simply select the desired genes from the " Gene coexpression " drop-down menu, such as " Gene1 " ( e.g. " TTR " ) and " Gene2 " ( e.g. " SPP1 " ), to visualize their co-expression in a low-dimensional representation. The " ViolinPlot / BoxPlot " tab can show the differences in gene expression or continuous cell information between different cell groups in the form of violin plots and hour plots. For example, the cell type " Stromal cell " has a high expression level in this data set. Users only need to select the corresponding information from the " Cell information ( X-axis ) " and " Cell Info / Gene name ( Y-axis ) " drop-down menus, and then select the desired visualization format in " Plot type " to obtain the visualization results. The " Proportion plot " tab can be used to calculate the cell composition in a single cell dataset. For example, " Cell information ( X-axis ) " selects " Cluster_id " and " Cell Info / Gene name ( Y-axis ) " selects " celltype ", and it can be observed that the proportion of cell types in each Cluster_id of this dataset is different. The " Bubbleplot / Heatmap " tab can visualize the expression of multiple genes in different cell types ( such as cell types and clusters ) through bubble plots or heat maps. For example, COL1A2 in the example gene is highly expressed in the cell type Stromal cell.
SCAN_ChIP
In addition to transcriptomic atlases, we are also interested in the epigenetic landscape of nervous systems. During development, the formation of specific patterns is strictly regulated by intricate and dynamic interactions between trans-factors and corresponding cis-regulatory elements. Therefore, the transcription factor binding profiles revealed by chromatin immunoprecipitation-sequencing (ChIP-seq) and the repertoire of cis-regulatory elements identified by Assay for Transposase Accessible Chromatin with high-throughput sequencing (ATAC-seq) are of particular interest. The "SCAN_ChIP" module provides ChIP-seq data for humans and mice, allowing users to freely explore the binding profiles and integrated analyses (motif enrichment, target prediction, GO, KEGG enrichment) of various transcription factors.
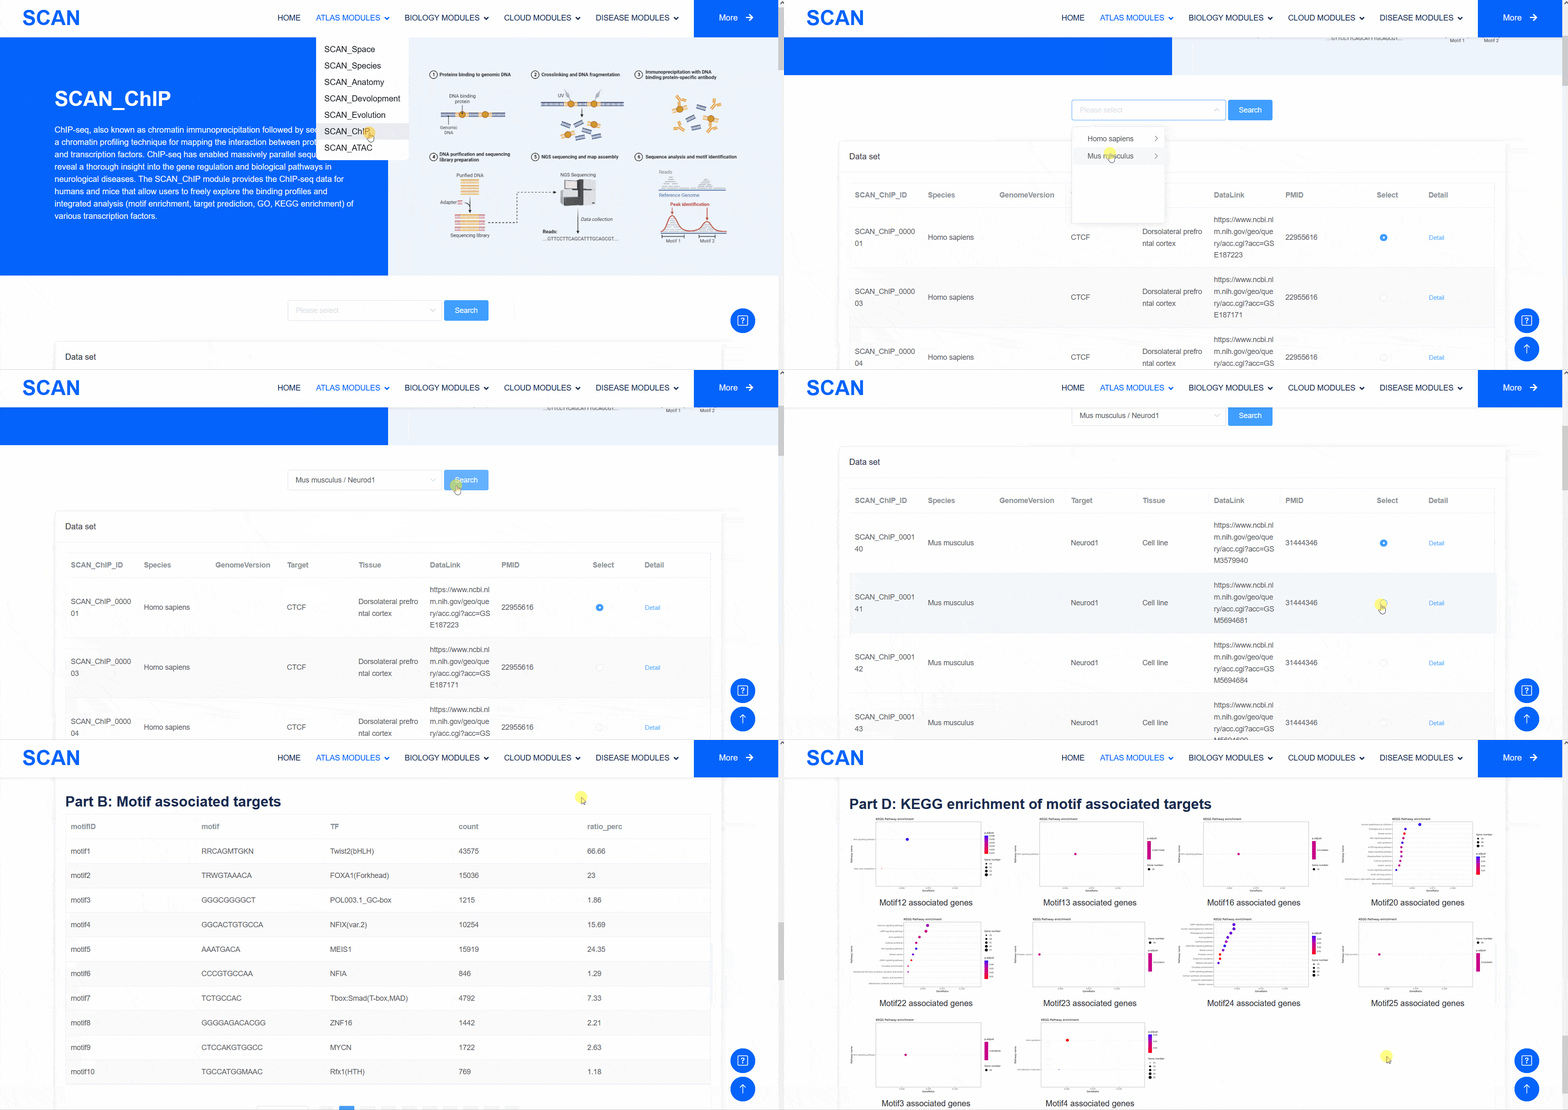
Select " SCAN_ChIP_000001 " as the sample data set, and click the " Detail " link to display detailed data set information on the new page.The three sliding windows " Input file " at the bottom of the page correspond to the bed files of transcription factors ( such as " CTCF " ) ChIP-seq, while " Part A : Motif enrichment " of " De novo motifs " and " Known motifs " are De novo motifs and Known motifs calculated by findMotifs, and the motif results are arranged in ascending order of P-value. "Part B : Motif associated targets " is a summary of the results of findMotifs. " Part C : GO enrichment of motif associated targets " is a visual display of GO enrichment analysis of motif-related genes.
SCAN_ATAC
In addition to transcriptomic atlases, we are also interested in the epigenetic landscape of nervous systems. During development, the formation of specific patterns is strictly regulated by intricate and dynamic interactions between trans-factors and corresponding cis-regulatory elements. Therefore, the transcription factor binding profiles revealed by chromatin immunoprecipitation-sequencing (ChIP-seq) and the repertoire of cis-regulatory elements identified by Assay for Transposase Accessible Chromatin with high-throughput sequencing (ATAC-seq) are of particular interest. The interactive "SCAN_ATAC" module help users analyze and explore the ATAC-seq dataset of different nervous system tissues. The ATAC peaks were intersected with the VISTA database to obtain experimentally verified enhancers.
Select the data set SCAN_ATAC_0048 in the organization " Brain " as the example data, and click the " Detail " link to display the detailed data set information on the new page. We first extract " Chromosome ", " Start ", " End ", and " CellType " information from the " Chip-Atlas " database to generate a new bed file, and then use Bedtools to intersect the processed bed file with the " VISTA Enhancer Browser " database data, and only the " positive " result is retained to create the final bed file. is the table presented in " Info ". In addition, users can click on " Download bed file " to get the bed file displayed in " Info ".

BIOLOGY MODULES
BIOLOGY MODULES content goes here.
SCAN_Footprint
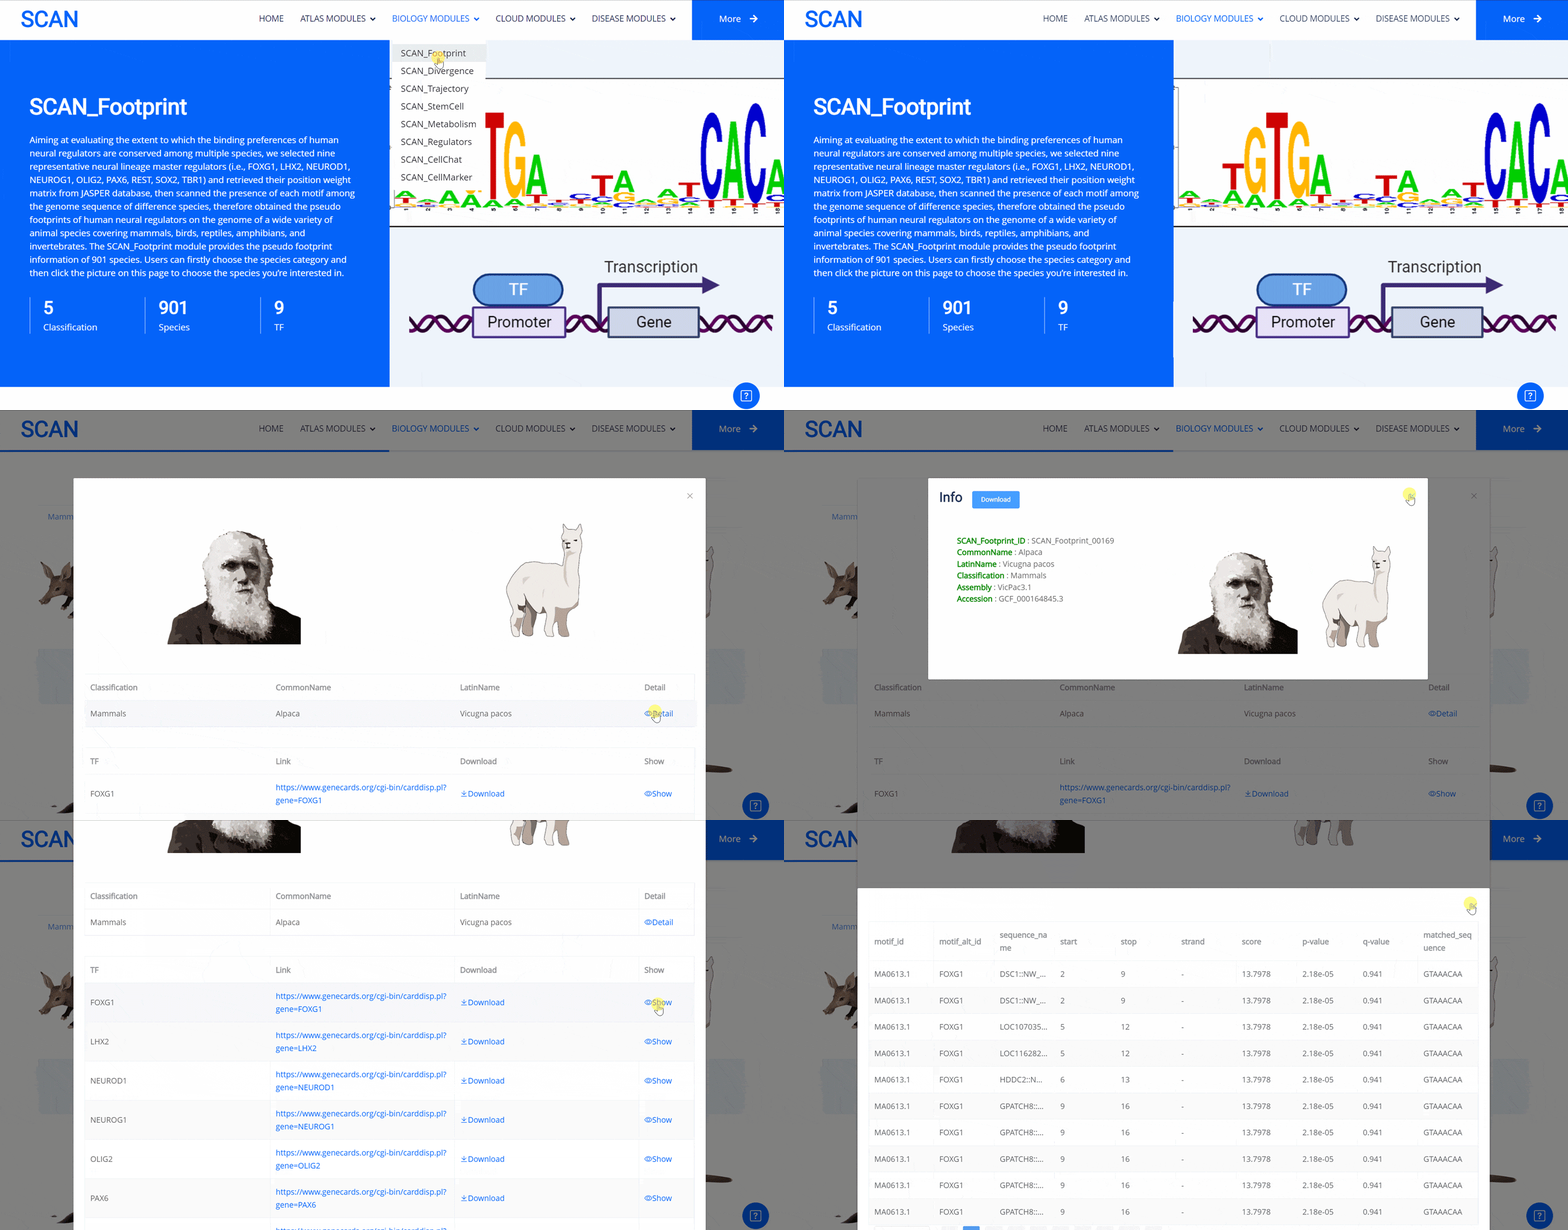
The emergence of novel transcription factor functions during evolution is mediated by multiple mechanisms, such as alterations in binding preferences of transcription factor proteins, changes in the relevant cofactor spectrum, and variations in the cis-regulatory element landscape. In evo-devo studies, a master regulator gene from one species (i.e., fruit fly) might be inserted into an evolutionarily distant species (i.e., mouse) to test its functional conservation and divergence, providing insights into the origin and evolution of novel phenotypes and underlying regulatory circuits. In this project, to evaluate to what extent the binding preferences of human neural regulators are conserved among diverse species, we selected nine representative neural lineage master regulators (i.e., FOXG1, LHX2, NEUROD1, NEUROG1, OLIG2, PAX6, REST, SOX2, and TBR1). We then scanned the presence of each motif among the genome sequences of 901 animal species, allowing the creation of a pseudo footprint profile of human neural regulators across the genomes of a wide variety of animal species, encompassing mammals, birds, reptiles, amphibians, and invertebrates.
Select the species " Gracilinanus agilis " as an example species, enter the suspension window, and click Detail in the first table to display the details of the species. Clicking on the show button at the end of the corresponding transcription factor line in the second table below shows that the species may have detailed information on the transcription factor binding site at 1000 bp upstream of start_codon and 1000 bp downstream of stop_codon, which is sorted in ascending order of p-vale. Click the download button to download the corresponding table information.

SCAN_Divergence
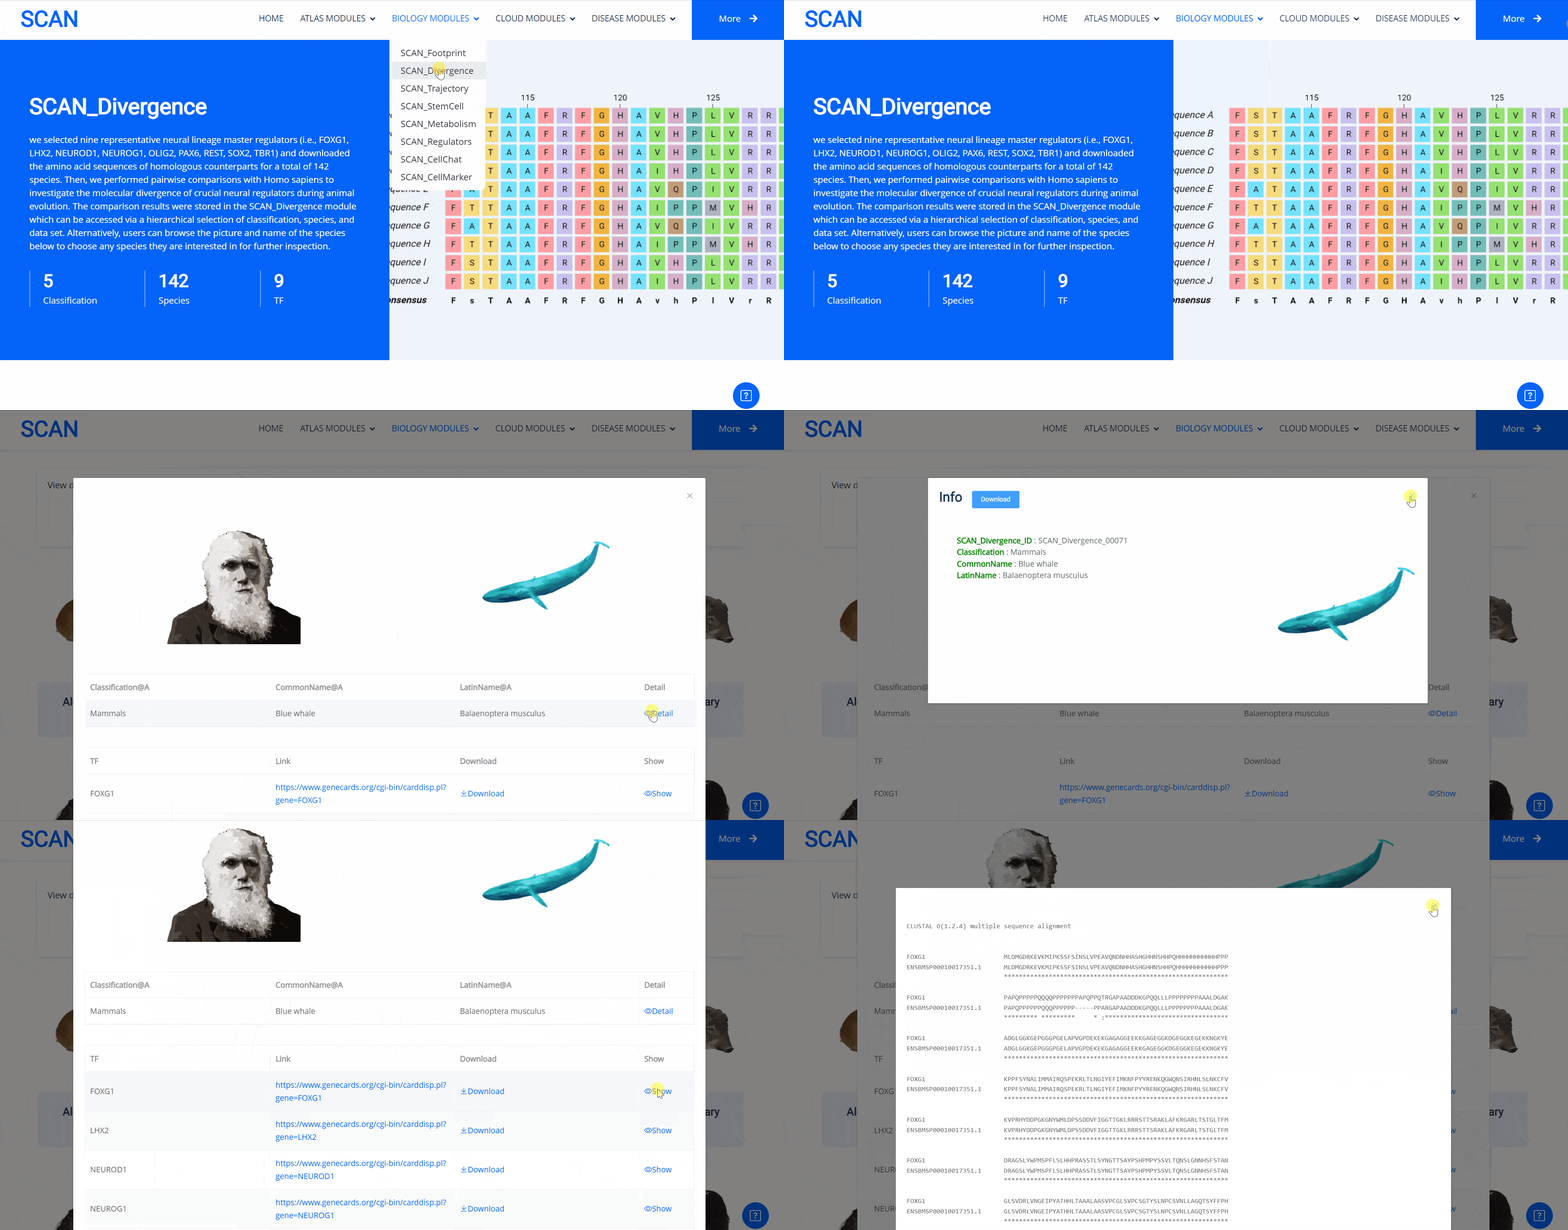
The emergence of novel transcription factor functions during evolution is mediated by multiple mechanisms, such as alterations in binding preferences of transcription factor proteins, changes in the relevant cofactor spectrum, and variations in the cis-regulatory element landscape. In addition to examining the availability of putative transcription factor binding sites, we also explored protein sequence divergence among multiple species for the abovementioned nine neural developmental regulators. We performed pairwise comparisons with Homo sapiens to investigate the molecular divergence of crucial neural regulators during animal evolution. The results of these comparisons are available in the "SCAN_Divergence" module, which users can navigate via a structured selection process based on classification, species, and dataset. Additionally, a visual guide displaying species images and names lets users easily select any species of interest for detailed examination.
Select the species " Blue Whale " as an example species, enter the suspension window, the first table click Detail to show the details of the species. The second table clicks the show button at the end of the corresponding transcription factor line to display the double sequence alignment results between the species and the human transcription factor orthologous sequence. Click the download button to download the corresponding comparison results.

SCAN_Trajectory
The processes and regulatory mechanisms of neural cell differentiation and lineage commitment have garnered substantial interest for many years. Here, the "SCAN_Trajectory" module provides an interactive interface for reconstructing the differentiation of neural cells based on gene expression data. Users simply select the species, tissues, and datasets of interest in the "Data selection" section, with the corresponding analysis results and gene expression heatmaps displayed in the resultant column.CytoTRACE was used to reconstruct the developmental statuses of different cell populations based on a single-cell expression matrix. Initially, the number of detectable genes in each cell was determined by summing the total number of genes greater than zero in each cell. Estimation of the gene counts signature (GCS) vector was then iteratively refined by comparing the local similarity between cells and applying a two-step smoothing procedure. Finally, to visualize the cell stemness prediction results, the "plotCytoTRACE" function was used, incorporating the cell type data of the object and single cell as parameters.
The cascade screening of this page allows users to select the single-cell data set of interest. After submission, the differentiation trajectories of different cell types in the data set are displayed.

SCAN_StemCell
Stem cells have attracted considerable attention due to their capacity to differentiate into multiple functional cell lineages of the nervous system. Stem cell development and stemness (neurogenesis) maintenance are not only related to developmental diseases of the nervous system but also closely related to the occurrence and development of neurodegenerative diseases such as Alzheimer's disease (AD) and Parkinson's disease (PD). Here, the "SCAN_StemCell" module provides an interactive tool for analyzing and visualizing cell stemness, aiding researchers in the identification and evaluation of cells with differentiation potential in single-cell sequencing datasets. The "SCAN_StemCell" module includes single-cell datasets of different neural tissues, allowing users to evaluate the differentiation potential of cells in neural tissues from different species. Through the "Data selection" section, users can choose specific species, tissues, and datasets, enabling automated data analysis and visualization directly on the platform.
Enter the SCAN_Stem page, select the data set of interest and click Submit, the page will automatically feedback the analysis results. The first image is a visual display of single cell data after dimensionality reduction. The subgraph on the left side uses gradient color to represent the degree of cell differentiation, and the right side labels each cluster with cell type. Figure 2 uses boxplot to visualize the degree of stemness of different cell types. Figure 3 shows the correlation between different genes and cell stemness.

SCAN_Metabolism
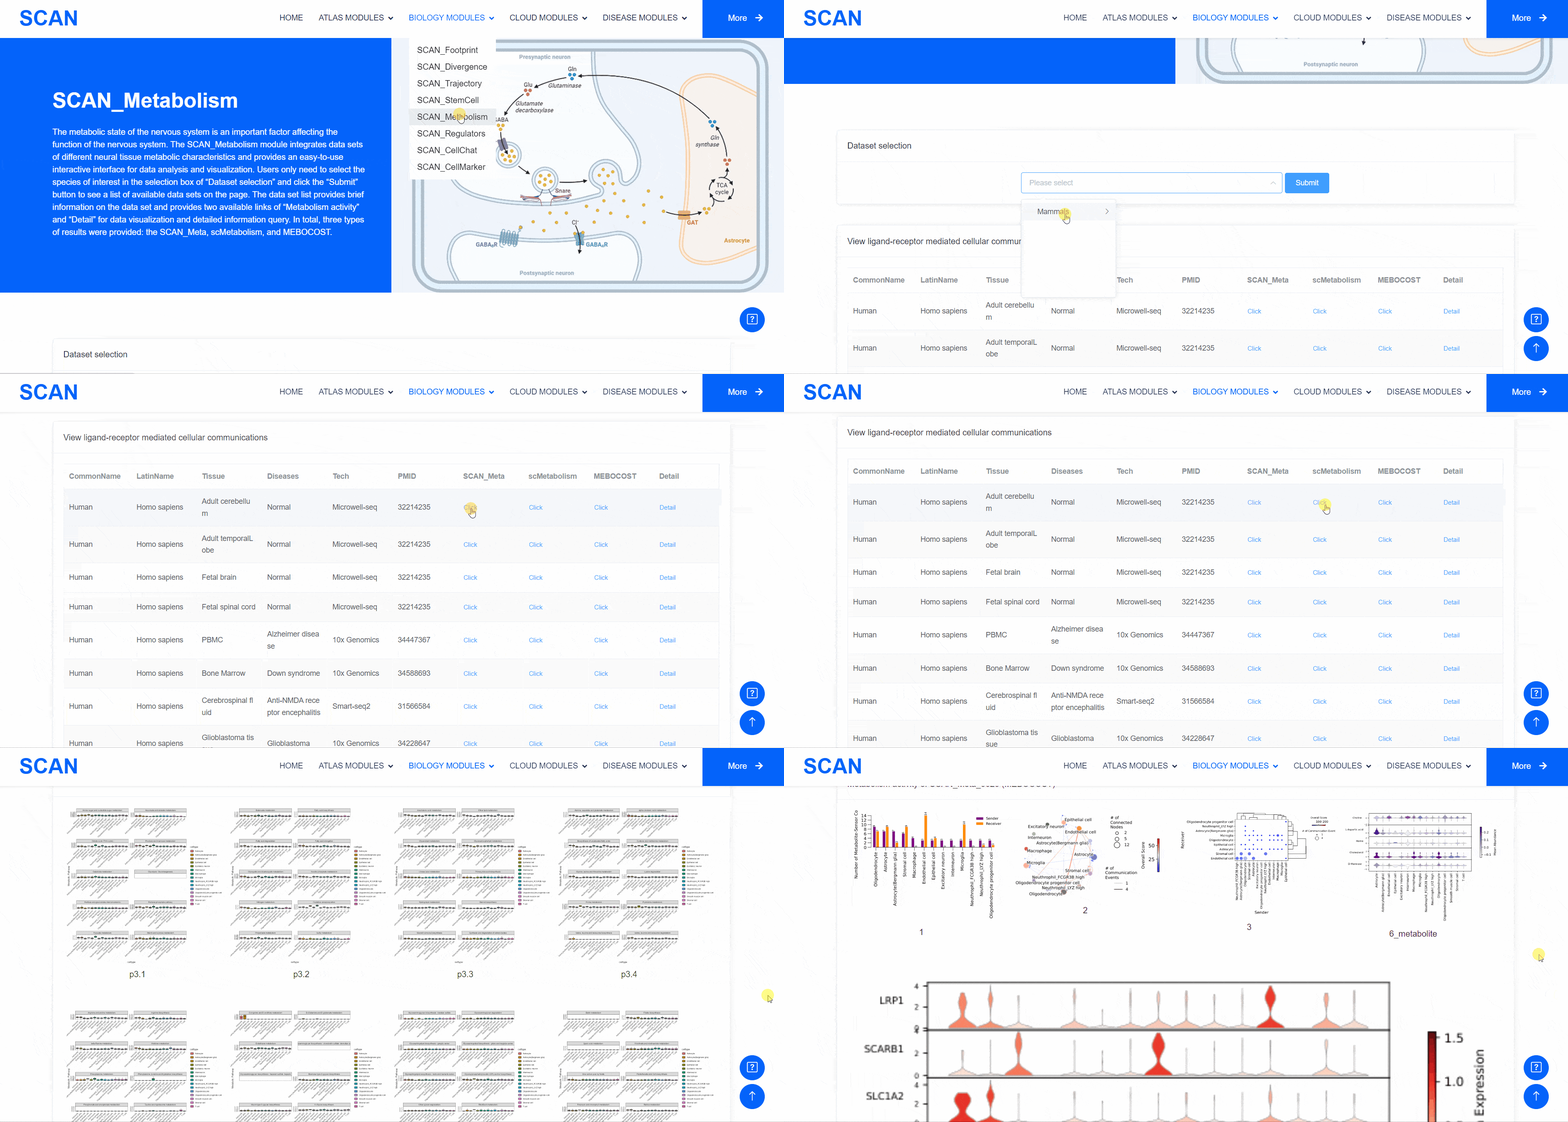
Metabolic state plays a crucial role in influencing the functionality of the nervous system. Within the "SCAN_Metabolism" module, datasets capturing the metabolic characteristics of various neural tissues are consolidated, offering an easy-to-use interactive interface for data analysis and visualization. Users can simply choose their species of interest from the "Dataset selection" drop-down menu and click the "Submit" button to view an array of available datasets on the page. Each dataset entry provides a brief overview and several links for data visualization and information queries. In total, three result categories are provided: i.e., SCAN_Meta, scMetabolism, and MEBOCOST.The SCAN_Metabolism module uses scMetabolism software to quantify the metabolic activity of human scRNA-seq data during both neurological and physiological states. The AUCell method was first executed using the "sc.metabolism.Seurat" function embedded in the scMetabolism package to quantify the activity of 85 metabolic pathways from the KEGG database . Subsequently, the "DimPlot.metabolism", "DotPlot.metabolism", and "BoxPlot.metabolism" functions were used to visualize the metabolic scores. For MEBOCOST analysis, the "mebocost.create_obj" function was employed to create a mebo object. Then, metabolite communication between different cell types was reconstructed based on a single-cell expression matrix using the "mebo_obj.infer_commu" function to infer intercellular communication, followed with visualization using "mebo_obj.eventnum_bar", "mebo_obj.commun_network_plot", "mebo_obj.count_dot_plot", and "mebo_obj.violin_plot".
By selecting the species " human " as the example species, and then selecting the physiological or pathological state below, the metabolic analysis can be carried out by using the three tools of " SCAN_Meta ", " scMetabolism " and " MEBOCOST ". Select the right side of the Human, Adult cerebellum, Normal data set and click the " click " button below the " SCAN_Meta " to display the metabolism of the data set using the " SCAN_Meta " tool. For example, SCAN_Meta_0020 ( SCAN_Meta ), internueron is relatively active in the " Acyl-CoA_hydrolysis " pathway. Clicking the " click " button below " scMetabolism " can display the metabolism of the corresponding data set and obtain the enrichment map of different pathways on the single cell map, the bubble map and box map of the enrichment of different cell types in different pathways. Click the " click " button below " MEBOCOST " to display the metabolism of the corresponding data set analyzed by this tool. Figure 1 shows the number of communications between the sending unit and the receiving unit. Figure 2 shows the intercellular metabolite sensor communication, and each point is a cell type. The size of the point represents the number of communications with other cell types. The directional line represents the communication from the sender cell type to the receiver cell type. The linewidth represents the number of metabolite sensor communications between the sender and the receiver. The color of the line shows the overall confidence, and the 3 figure shows the communication between the paired cell types, where the x-axis is the sending cell type and the y-axis is the receiving cell type. The size of the point represents the number of metabolic sensor communications between the sender and the receiver. The color of the point represents the confidence of the communication between the sender and the receiver. The 6_metabolite plot shows the average metabolite presence of cells in different cell types, and the 7_sensor_exp plot shows the average sensor gene expression of cells in different cell types.
SCAN_Regulators
The "SCAN_Regulators" module aggregates transcription factor regulatory networks from scRNA-seq datasets of nervous systems from diverse species, offering a streamlined tool for data analysis and representation. By selecting the species, tissues, datasets, and cell types of interest from the "Dataset selection" dropdown menu, users can instantly view the data visualization results on the same page.
After selecting the data set of interest and clicking submit, the visualization results after analysis can be obtained. The first part of the picture shows the visualization results of pyscenic "s inference of gene regulatory networks based on single-cell data sets. The second part of the picture shows the results of GO enrichment analysis of these genes.

SCAN_CellChat
The "SCAN_CellChat" module integrates cell interaction networks from the scRNA-seq datasets of different species, providing a visualization tool for exploring intercellular communication mediated by ligands and receptors. To visualize the data, users can choose the appropriate species, tissue, and dataset from the "Dataset select" dropdown menu, with results then immediately displayed on the current page.PySCENIC and CellChat were used to infer the transcription factor regulatory network and ligand-receptor-mediated cell crosstalk. In the SCAN_CellChat module, hypothetical interactions between different cell types were inferred based on the ligand-receptor database in CellChatDB. First, a new CellChat object was created from a Seurat object using the "createCellChat" function, with addMeta then used to import the meta information of the cell. After importing the ligand-receptor data in CellChatDB, the "ComputeCommunProb" function was used to calculate the probability of intercellular communication at the ligand-receptor level. The "ComputeCommunProbPathway" function was then applied to calculate the communication probability of all ligand-receptor interactions related to each signaling pathway, and the "aggregateNet" function was used to calculate the number of links to further aggregate the intercellular communication network. In the pySCENIC module, the "pyscenic grn" command was used to predict the expression of genes according to the expression of transcription factors, and the co-expression relationship between transcription factor and single-cell expression matrix genes was inferred. Then, "pyscenic ctx" was used to synthesize the transcription factor-gene module and target gene prediction results to form a gene regulatory network module containing transcription factor and target genes. Finally, the activity of each regulatory factor was evaluated using the "pyscenic aucell" command. Visualization of the results was completed using igraph and ggplot2 .
The module shows the intercellular communication analysis of the single cell data set based on the R package CellChat, and the analysis results are visualized in the form of network diagrams and heat maps. The table at the bottom of the page shows detailed information about the interaction between cells, which provides users with a download link.

SCAN_CellMarker
The neural system is composed of various cell types with distinct morphologies and molecular signatures. The "SCAN_CellMarker" module consists of datasets representing diverse neural cell types under both physiological and pathological disease states, including glia, neurons, cycling cells, cycling progenitors, and endothelial cells. Custom_CellMarker includes cell markers identified in this study. Subsequently, quality control, standardization, and other processes were performed using the Seurat package, followed by manual annotation of cell types. Finally, the FindAllMarkers function was employed to identify marker genes specific to different cell types across various species. The screening criteria were p_val_adj < 0.01, avg_log2FC > 1, and pct.1 > 0.25.

Annotation MODULES
Annotation MODULES content goes here.
SCAN_Celltypist
The "Annotation Section" includes two modules: i.e., "SCAN_Celltypist" and "SCAN_SingleR". With the increasingly widespread application of single-cell sequencing technology, the need for rapid and accurate cell annotation is a considerable challenge, with most studies still relying on manual annotation approaches. Both the "SCAN_Celltypist" and "SCAN_SingleR" modules employ automatic cell annotation methods, comparing data with annotated reference data. Users can initiate the annotation pipeline by selecting the relevant species, entering their email address, and uploading their dataset to our computing server. Upon completion, SCAN will automatically send the corresponding analysis results to the user, with the resultant annotation cell type identity also displayed on the webpage.
Firstly, the user needs to enter an email address that can be used to receive the results, then click " Select Model " to select the reference dataset type of the file that needs to be annotated, and then click " Majority Voting " to select whether to perform Majority Vote.Finally, upload the dataset that you need to annotate below to get the annotated map and the corresponding meta table.

SCAN_SingleR
The "Annotation Section" includes two modules: i.e., "SCAN_Celltypist" and "SCAN_SingleR". With the increasingly widespread application of single-cell sequencing technology, the need for rapid and accurate cell annotation is a considerable challenge, with most studies still relying on manual annotation approaches. Both the "SCAN_Celltypist" and "SCAN_SingleR" modules employ automatic cell annotation methods, comparing data with annotated reference data. Users can initiate the annotation pipeline by selecting the relevant species, entering their email address, and uploading their dataset to our computing server. Upon completion, SCAN will automatically send the corresponding analysis results to the user, with the resultant annotation cell type identity also displayed on the webpage.
The user only needs to click on the " Select Model " to select the reference data set type of the file that needs to be annotated and upload the data set that the user needs to annotate below to obtain the annotated map and the corresponding meta table.

DISEASE MODULES
DISEASE MODULES content goes here.
SCAN_DiseaseView
The "SCAN_DiseaseView" module contains the scRNA-seq datasets of over 100 neurological diseases, including AD, glioblastoma, Rett syndrome, anti-NMDA receptor encephalitis, and HD, across five species (humans, mice, macaques, tree shrews, and cynomolgus monkeys) (Fig. 4). Users can select the species and diseases of interest from the "View disease cell atlas via hierarchical select" drop-down menu, then click the "Submit" button to open a new function page, which provides a brief introduction to the disease and displays available datasets. The module also features a word cloud, providing a broad landscape view of the disease cell atlas, with each word linked to a webpage containing all datasets related to a specific neurological disease.
Users can select the species and diseases of interest in the drop-down menu of the " View disease cell atlas via hierarchical select " module, and then click the " Submit " button to open a new function page, which provides a brief introduction to the disease and displays the available disease data set. Clicking on the " Detail " link in the table will cause a pop-up window and display detailed dataset information on the pop-up window. Clicking on the " ShinyLink " link will open a new page with a seven-tab navigation menu for interactive analysis of single-cell datasets. In addition, users can also access all available data set information for the corresponding disease by clicking on the word cloud map.


SCAN_bioMarker
Biomarkers represent a category of biomolecules or clinical traits that display differential expression in specific conditions, playing a crucial role in diagnosing and detecting diseases. Here, the SCAN_bioMarker module provides a comprehensive range of biomarkers for brain diseases. Users can filter these biomarkers according to five categories (i.e., exosomes, proteins, metabolites, RNAs, others). The module integrates the biomarkers of the central nervous system and provides a simple interactive interface for users to screen data of interest. By selecting the appropriate tab, users can view a list of biomarkers in the "dataset" column, detailing disease type, marker type, classification, and data source. The "Detail" link allows users to browse further details related to the biomarker from the automatic pop-up page. In addition, users can download the data using the "Download" button at the top of the detailed information page.
For example, select the card Exosomes, " Data set " can display all the biomarkers classified as " Exosomes ". Then click on the " Detail " link to display detailed dataset information on the new page, such as the specific classification of biomarkers, article sources, etc.

SCAN_scMarker
In addition to public biomarkers, we also screened novel putative biomarkers by leveraging the unprecedented resolution of scRNA-seq technology and the largest collection of high-quality disease atlas data. Notably, the "SCAN_scMarker" module consists of scRNA-seq datasets of 16 representative neurological diseases, including AD, autism spectrum disorder (ASD), and PD. Within the module, users can simply select the corresponding disease tab to view a list scRNA-seq data for the specific disease in the "dataset" column. The list displays a concise overview of the dataset and provides a "Detail" link to access the detailed information page, which consists of four parts. Firstly, a "Download" button at the top allows users to access and download data. Secondly, the page offers detailed descriptions about the disease, gene, cell type, and data source. Thirdly, two distinct links, "ShinyLinkDiz" and "ShinyLinkCK", are provided for scRNA-seq data from diseased tissue samples and normal control tissue samples, respectively. Finally, users can view UMAP diagrams of cell types, gene expression profiles in disease and normal states, and violin diagrams of genes across different cell types. Clicking on the "ShinyLinkDiz" or "ShinyLinkCK" links redirects users to a comprehensive analysis and visualization platform.
The Alzheimer disease dataset SCAN_Marker_000001 was selected as the example dataset. Users only need to click the " Detail " link to display detailed data set information on the new page. The page consists of four parts. First, the " Download " button at the top allows users to access and download data. Secondly, the page provides detailed descriptions of diseases, genes, cell types, and data sources. Thirdly, two different links " ShinyLinkDiz " and " ShinyLinkCK " were provided for scRNA-seq data of diseased tissue samples and normal control tissue samples, respectively. Finally, at the bottom of the page, you can see the UMAP map of the cell type, the expression profile of the gene LINGO1 in the disease and normal state, and the violin map of the gene LINGO1 in different cell types. Clicking on the " ShinyLinkDiz " or " ShinyLinkCK " link will redirect users to a new page with a seven-tab navigation menu for Alzheimer disease group and control group.


